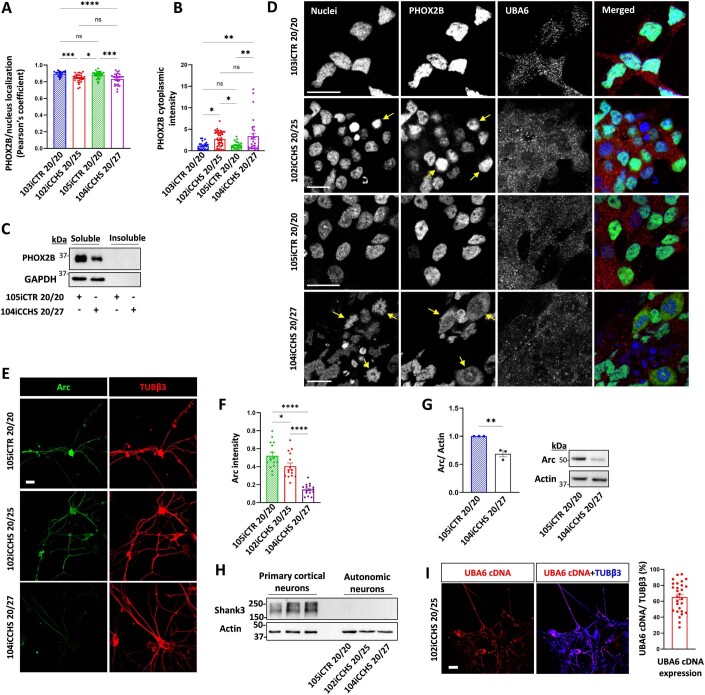
Figure EV5. Patient-derived autonomic neurons showing cytoplasmic mislocalized soluble PHOX2B, and decreased Arc levels.
(A, B) Quantification of the association of endogenous PHOX2B with the nucleus (Pearson’s coefficient) in autonomic neurons from control and CCHS patients. Quantification is shown also for PHOX2B cytoplasmic intensity. Total number of neurons analyzed was 160 for 103iCTR 20/20, 350 for 102iCCHS 20/25, 380 for 105iCTR 20/20 and 550 for 104iCCHS 20/27. The results represent additional analysis from the same neurons analyzed in Fig. 5B. (C) Autonomic neurons from control and CCHS patients were analyzed for the levels of PHOX2B in the soluble and sarkosyl-insoluble fractions. (D) iPSC-derived human autonomic neurons from control and CCHS patients were labeled by nuclear staining (colored blue, abnormal nuclear morphology marked with arrows), and for endogenous PHOX2B (colored green) and endogenous UBA6 (colored red). Images indicate events of severe cytoplasmic mislocalization of PHOX2B (marked with arrows). Scale bar 10 μm. (E, F) Immunostaining of Arc (colored green) and TUBβ3 (colored red) in autonomic neurons from control and CCHS patients. Scale bar 20μm. For quantification, Arc intensity was normalized to TUBβ3 in different image fields. Number of neurons analyzed 105iCTR 20/20 n = 105, 102iCCHS 20/25 n = 220, 104iCCHS 20/27 n = 166. (G) Analysis of Arc levels in the autonomic neurons from control and CCHS patient-derived neurons. Results are normalized to control line. n = 3 biological replicates. (H) Analysis of shank3 levels in mouse primary cortical neurons and in autonomic neurons from control and CCHS patients. (I) Quantification of the abundance of UBA6 cDNA in CCHS patient-derived neurons transduced with mCherry tagged-UBA6 lentiviral vectors. Representative images are presented for mCherry (colored red) and TUBβ3 staining (colored blue) in the patient neurons (scale bar 20 μm). For quantification, the percentage of mCherry coverage from the TUBβ3 staining was calculated in different image fields (n = 80 neurons). Data information: Data points in (A, B, F, G, I) represent mean ± s.e.m. P values were calculated by one-way ANOVA Tukey’s test (A, B, F) or paired 2-tailed t test (G). *P < 0.05, **P < 0.01, ***P < 0.001 ****P < 0.0001, ns non-significant.

