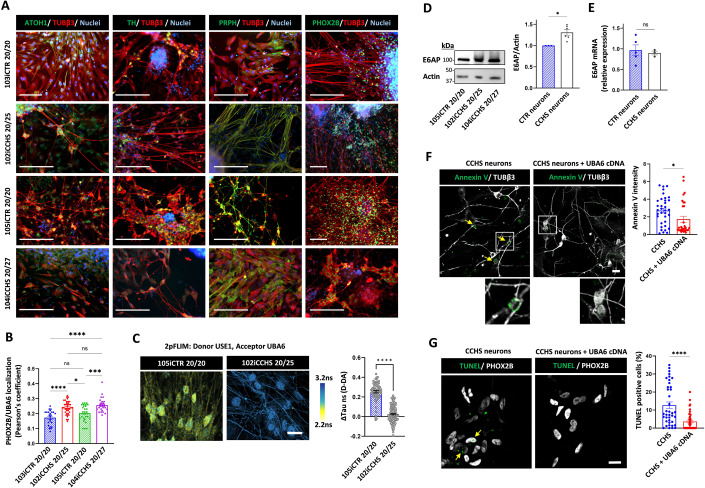
Figure 5. UBA6 overexpression rescues CCHS patient-derived autonomic neurons from neuronal death.
(A) Characterization of iPSC-derived autonomic neurons at day 31 of differentiation from healthy controls and CCHS patients. Immunocytochemistry of PHOX2B, βIII-tubulin (TUBβ3), tyrosine hydroxylase (TH) peripherin (PRPH), and atonal BHLH Transcription Factor 1 (ATOH1). Scale bar 200 μm. (B) Quantification of the association of endogenous UBA6 with endogenous PHOX2B (Pearson’s coefficient) in autonomic neurons from control and CCHS patients. Total number of neurons analyzed in different imaged fields was 160 for 103iCTR 20/20, 350 for 102iCCHS 20/25, 380 for 105iCTR 20/20 and 550 for 104iCCHS 20/27. Images are shown in Figure EV5D. (C) Representative 2pFLIM pseudo-colored images of control and CCHS patient-derived neurons, stained for USE1 and UBA6 using secondary antibodies as donor (Alexa 488) and acceptor (Alexa 555), respectively. Scale bar is 20 µm. Comparison of the difference in lifetime for each group, for the subtraction of donor only to donor and acceptor fluorescence lifetime. Control neurons 0.253 ± 0.012, patient neurons 0.025 ± 0.007 (n = 67 and 153 cells, respectively). (D) Analysis of E6AP levels in control (105iCTR 20/20) and CCHS patients (102iCCHS 20/25 and 104iCCHS 20/27). Results are normalized to control. n = 3–6 biological replicates. (E) Quantification of E6AP mRNA in the control and patient-derived autonomic neurons. n = 3–5 biological replicates. (F, G) Patient-derived autonomic neurons (102iCCHS 20/25) were transduced with mCherry-UBA6 cDNA lentiviral vectors. (F) Representative images of Annexin V signal (colored green and marked with arrows) of the transduced and non-transduced patient neurons. Scale bar 20 μm. Quantification of cell surface Annexin V intensity in different image fields (transduced n = 80 cells, non-transduced n = 92). (G) Representative images of TUNEL staining (colored green marked with arrows) of the transduced and non-transduced patient neurons. The percentage of the TUNEL positive PHOX2B expressing cells is shown. At least 1000 PHOX2B expressing cells were analyzed. Data information: Data points in (B–G) represent mean ± s.e.m. P values were calculated by one-way ANOVA Tukey’s test (B), unpaired 2-tailed t test (C, E–G) and paired 2-tailed t test (D). *P < 0.05, ***P < 0.001, ****P < 0.0001, ns non-significant. Source data are available online for this figure.

