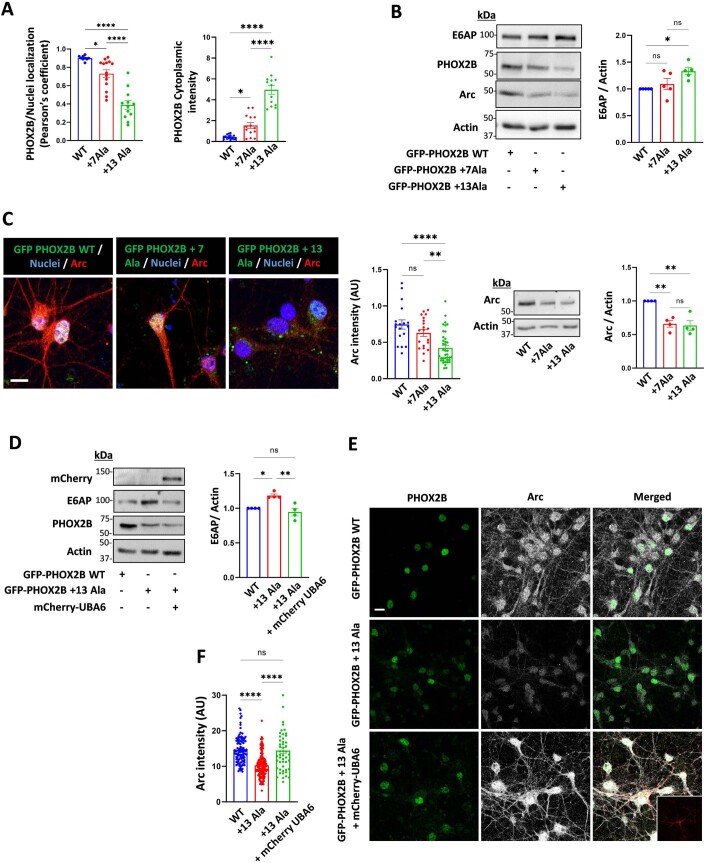
Figure EV4. UBA6 overexpression affects E6AP and Arc levels in mutant PHOX2B transduced neurons.
(A–C) Mouse primary cortical neurons were transduced with lentiviral vectors expressing GFP-tagged WT PHOX2B or mutant PHOX2B (+7Ala or +13Ala). (A) Quantification of the association of GFP-PHOX2B with the nucleus (Pearson’s coefficient) is presented as well as GFP-PHOX2B cytoplasmic intensity, related to Fig. 4C. (B) Analysis of E6AP and Arc levels in the WT and mutant PHOX2B-expressing neurons (n = 5 and n = 4 biological replicates, respectively). (C) Quantification of Arc intensity in the GFP-PHOX2B expressing neurons is presented (image scale bar 10 μm) as well as a blot showing Arc protein levels. Results represent the average values from neurons in different imaged fields. n = 20, n = 30 and n = 100 neurons analyzed for WT PHOX2B, mutant PHOX2B +7Ala and +13Ala, respectively. (D–F) The neurons were transduced with lentiviral vectors expressing GFP-WT PHOX2B, GFP-mutant PHOX2B (+13Ala) with or without lentiviruses encoding for mCherry-UBA6. (D), E6AP levels were analyzed in cell lysates. Results are normalized to WT PHOX2B. n = 4 biological replicates. (E, F) Quantification of Arc intensity in cycloheximide-treated GFP-PHOX2B expressing neurons that were positive or negative to mCherry. n = 110, n = 150 and n = 50 neuronal cell bodies analyzed for WT PHOX2B, mutant PHOX2B and mutant PHOX2B + UBA6, respectively. Inset shows mCherry signal. Scale bar 10 μm. AU arbitrary units. Data information: Data points in (A–D, F) represent mean ± s.e.m. P values were calculated by one-way ANOVA Tukey’s test (A–D, F). *P < 0.05, **P < 0.01, ****P < 0.0001, ns non-significant.

