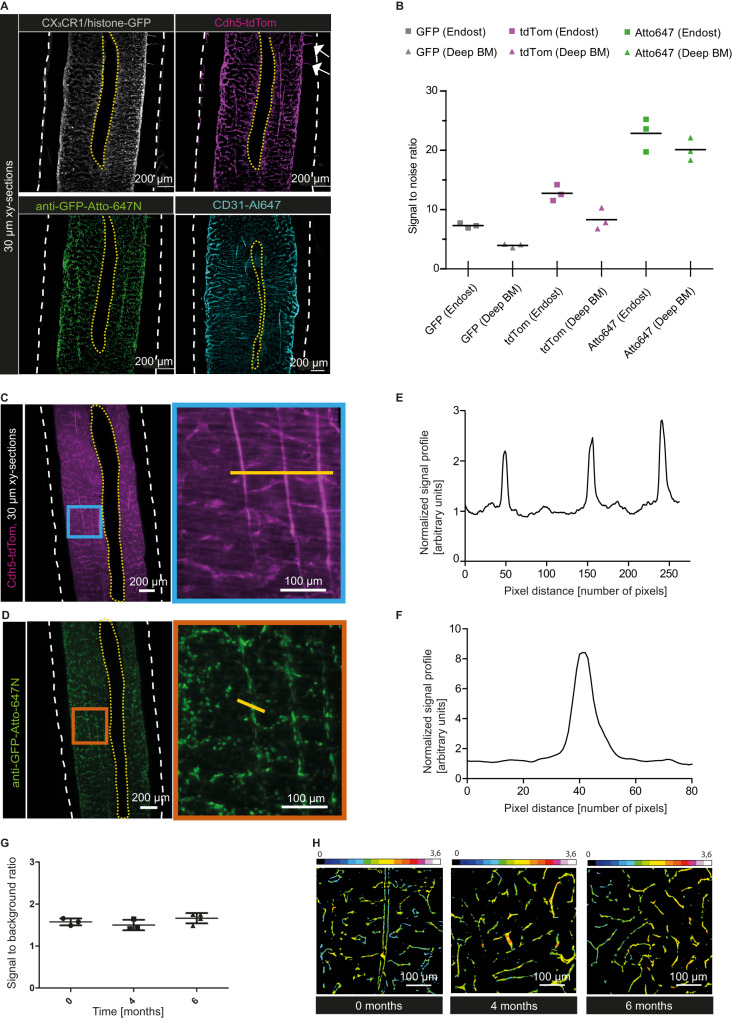
Fig. 2. Quantification of fluorescent signals at endosteal and deep BM regions.
A Representative xy-orthogonal slices (30 µm thick) of deep BM regions. White arrows point at exemplary transcortical vessels. CX3CR1/histone-GFP signal in gray (12 µm background subtracted), Cdh5-tdTom signal in magenta (20 µm background subtracted), anti-GFP-Atto-647N signal in green (12 µm background subtracted), CD31-Al647 signal in cyan (25 µm background subtracted). White dashed lines indicate bone outlines, yellow dashed lines indicate the central sinus. B Signal-to-noise ratio (SNR) of endogenous GFP signal, endogenous tdTom signal and anti-GFP-Atto647N signal in endosteal and deep BM regions. Data show mean (n = 3) of individual, young mice and data points are the mean of three consecutive z-slices of one femur each. Source data are provided as a Source Data file. C Representative z-slice (30 µm thick) showing the Cdh5-tdTom signal in magenta within the deep BM. Right: Zoom-in at the blue framed region shows three straight-running vessels. White dashed lines indicate bone outlines, yellow dashed lines indicate the central sinus. Yellow line indicates region of the signal profile in (D). D Line plot shows the tdTom signal profile normalized to the background. Source data are provided as a Source Data file. E Representative z-slice (30 µm thick) within the deep BM, which shows the CX3CR1/histone-GFP signal nanoboosted by anti-GFP-Atto647N in green. Right: Zoom-in at the orange framed region. White dashed lines indicate the bone outlines, yellow dashed lines indicate the central sinus. Yellow line marks the pixels used to determine the signal profile in (F). F Line plot shows the anti-GFP-Atto647N signal profile normalized to the background. Source data are provided as a Source Data file. G Signal-to-background ratio (SBR) of the tdTom signal 0, 4 and 6 months after clearing with MarShie. Data are mean ± SD of n = 3 femur (0 and 4 months) and n = 4 femur (6 months). Source data are provided as a Source Data file. H Color-coded SBR (intensity indicated by the rainbow scale) from Cdh5-tdTom, up to 6 months after clearing.

