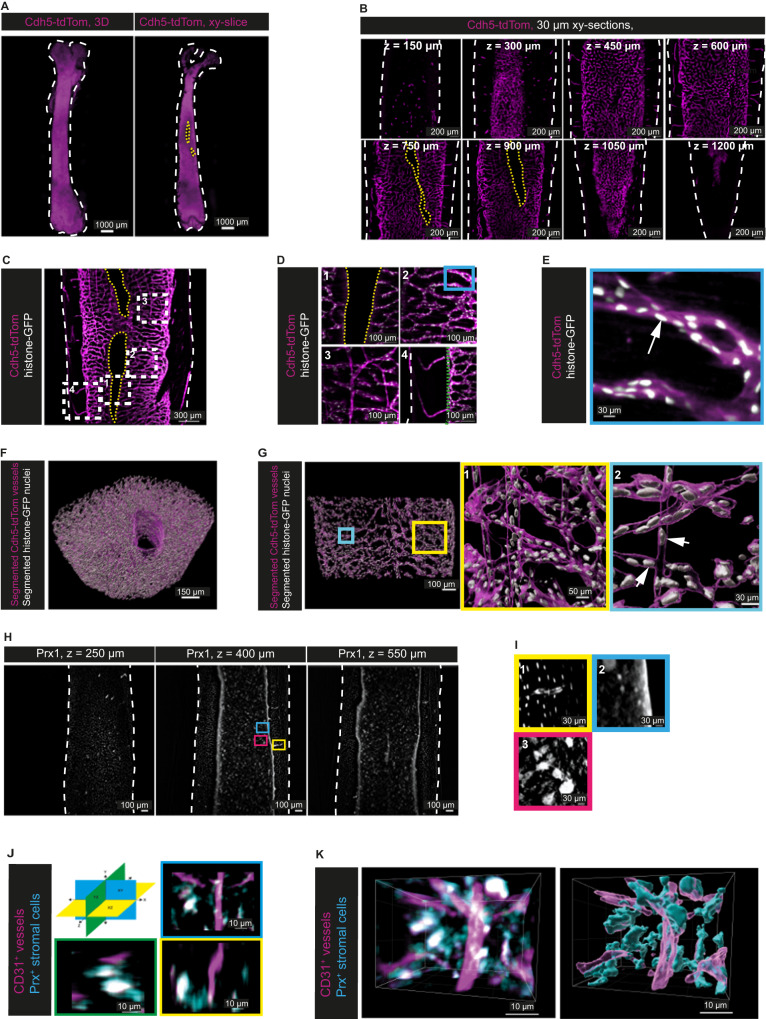
Fig. 3. Imaging and pre-processing of the BM stromal compartment throughout the whole femur and at subcellular resolution.
A Left: 3D-reconstruction of a murine femur after clearing (Cdh5-tdTom reporter mouse, 20 weeks). Right: xy-orthogonal slice (30 µm) within deep bone marrow. Cdh5-tdTom signal in magenta. White dashed lines in (A–D) indicate bone outlines, yellow dashed lines indicate the central sinus. B Representative xy-orthogonal slices (30 µm) throughout the bone marrow (every 150 µm in z). Cdh5tdTom signal in magenta, n = 4 analyzed in independent experiments. C Exemplary xy-orthogonal slice (50 µm thick) within diaphyseal deep marrow (Cdh5-tdTom/histone-GFP mouse, 20 weeks), rectangles indicate zoom-ins. Cdh5-tdTom signal in magenta, histone-GFP+ in white, n = 4 analyzed in independent experiments. D Zoom-ins of (C) show morphologically divergent vessels: (1) central sinus-lining endothelium, (2) sinusoidal network, (3) straight arteries, (4) transcortical vessels (endost marked by green line). E Zoom-in of blue rectangle in d2 marks histone-GFP signal of an endothelial nucleus (white arrow). F 3D-segmentation of Cdh5-tdTom+ vasculature and histone-GFP+ endothelial nuclei within a diaphyseal volume (500 µm in y, without cortex). G xy-orthogonal enlarged slice of the 3D-segmentation in (F), rectangles indicate zoom-ins. (1) Zoom-in highlights 3D-segmentation of arterial-like straight vessels and sinusoids, (2) Zoom-in highlights segmented endothelial nuclei (white arrows). H xy-orthogonal slices (12 µm thick) of two independent experiments (Prx1-YFP fate map reporter mouse, 23 weeks old). White dashed lines in (A–D) indicate bone outlines. Blue, magenta, and yellow frames mark zoom-ins. I Zoom-ins of the Prx1-YFP signal from different MSC types: (1) Osteocytes in the cortex and MSCs enveloping a transcortical vessel, (2) Endosteal signal and small, round MSCs, (3) large MSCs with extensions. J 3D representation of stromal cells (cyan) in Prx1-RFP fate map reporter mice in combination with vessel labeling by injection of fluorescently labeled anti-CD31 antibodies (magenta) highlights the dimensions of single stromal cells in x,y and z as indicated in the schematic. K Stromal and vascular networks in Prx1-RFP mice injected with anti-CD31 antibodies (left) can be segmented (right).

