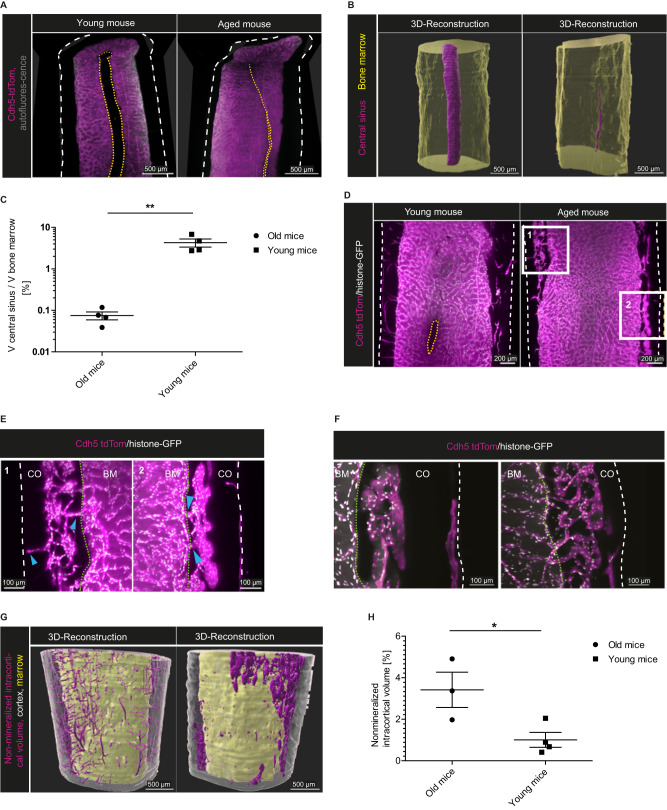
Fig. 4. Age-related vascular changes in the bone marrow.
A xy- and xz-orthogonal slices (50 µm thick) of the femoral diaphysis show a significant volumetric reduction of the central sinus (yellow dashed lines) during aging. Left: young mouse (Cdh5-tdTom reporter mouse, 25 weeks), Right: aged mouse (Cdh5-tdTom reporter mouse, 84 weeks). Cdh5-tdTom signal in magenta. Outer cortical borders are marked by white dashed lines. Images represent four independent experiments. B 3D-segmentation from diaphyseal whole mounts, same samples as in (A). Bone marrow volume in yellow, central sinus volume in magenta. C Proportion of sinus volume to total marrow volume in the diaphysis (analysis 2000 µm in y-axis) comparing young (20–25 weeks) and aged (84–86 weeks) mice. Data of n = 4 per age group (mean ± SD) analyzed by two-tailed, unpaired t test, p = 0.0044. Source data are provided as a Source Data file. D Representative xy-orthogonal slices (50 µm thick) of the diaphysis highlighting the cortical structure. Left: young, Cdh5-tdTom/histone-GFP mouse (20 weeks) and Right: aged mouse (86 weeks). Three and four independent experiments of old and young mice, respectively. Cdh5-tdTom+ in magenta, histone-GFP+ in white, bone outlines marked by white dashed lines, central sinus marked by yellow dashed lines. E Zoom-ins of areas marked by white rectangles in (D), showing intracortical marrow islands. Blue arrows point to vascular connections between those structures and the marrow cavity and periost. Endost marked by green dotted lines, bone outlines marked by white dashed lines in (E, F), BM bone marrow, CO cortex. F Examples of convoluted and branched intracortical vessels in aged mice, different regions from the individual in (D) are shown (50 µm thick sections). Cdh5-tdTom signal in magenta, histone-GFP signal in white, autofluorescence in gray. G 3D-Segmentation of cortex (gray), non-mineralized cortical volume (magenta) and marrow volume (yellow) in whole-mounts of the samples shown in (D). H Non-mineralized intracortical volume in the distal diaphysis (analysis 2000 µm in y-axis) comparing young and aged mice. Data of n = 3 (old), n = 4 (young) mice (mean ± SD) analyzed by two-tailed, unpaired t test, p = 0.0336. Source data are provided as a Source Data file.

