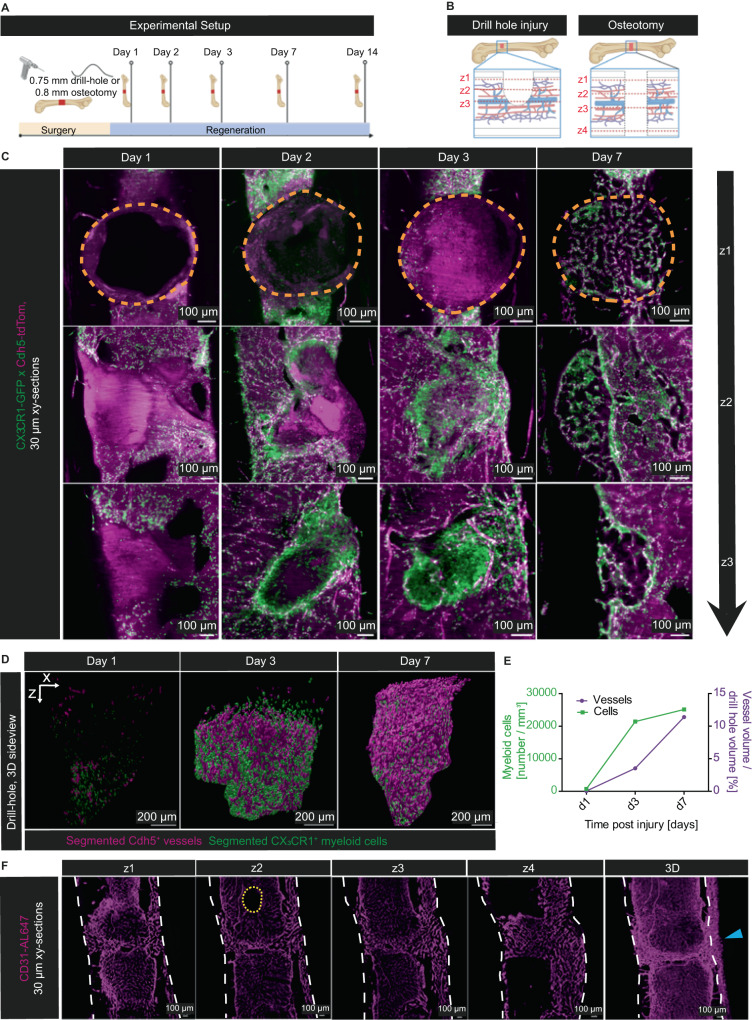
Fig. 6. Analysis of bone regeneration models in 3D using MarShie.
A Schematic of the experimental setup for analyzing bone regeneration after either drill hole injury or osteotomy. Illustration created with BioRender.com. B Schematic of the drill hole injury and the osteotomy. Dashed red lines indicate the extent (depth) of each injury shown in (C) and (F) Illustration created with BioRender.com. C Representative xy-orthogonal slices (30 µm thick) at day 1, 2, 3 and 7 after drill hole injury (n = 5 per time point, analyzed in 3 independent experiments). Three slices throughout the z-depth of the drill hole injury are shown per time point, as illustrated in (B). Cdh5-tdTom in magenta, CX3CR1-GFP in green, histone-GFP in white. Drill hole areas are marked by dashed orange lines. D 3D-Segmentation of the Cdh5-tdTom+ vascular system (in magenta) and the CX3CR1-GFP+ myeloid cells (in green) within the drill hole at day 1, 3 and 7 after injury. E Quantification of CX3CR1+-GFP+ myeloid cell numbers per mm3 and Cdh5-TdTom+ endothelia cells (vessel volume/drill hole volume) over time. Source data are provided as a Source Data file. F Representative xy-orthogonal slices (30 µm thick) at day 14 after osteotomy show abundance of CD31+ vessels throughout the fracture gap (n = 5, analyzed in three different experiments). Four slices throughout the z-depth of the osteotomy gap are shown as indicated in (B). Blue arrowhead points at massive medial periosteal thickening and sprouting into the osteotomy gap. CD31-Al647+ in magenta (25 µm background subtracted); upper border of drill hole injury is outlined by dashed orange lines, outer cortical borders are marked by dashed white lines, central sinus is outlined by dashed yellow lines.

