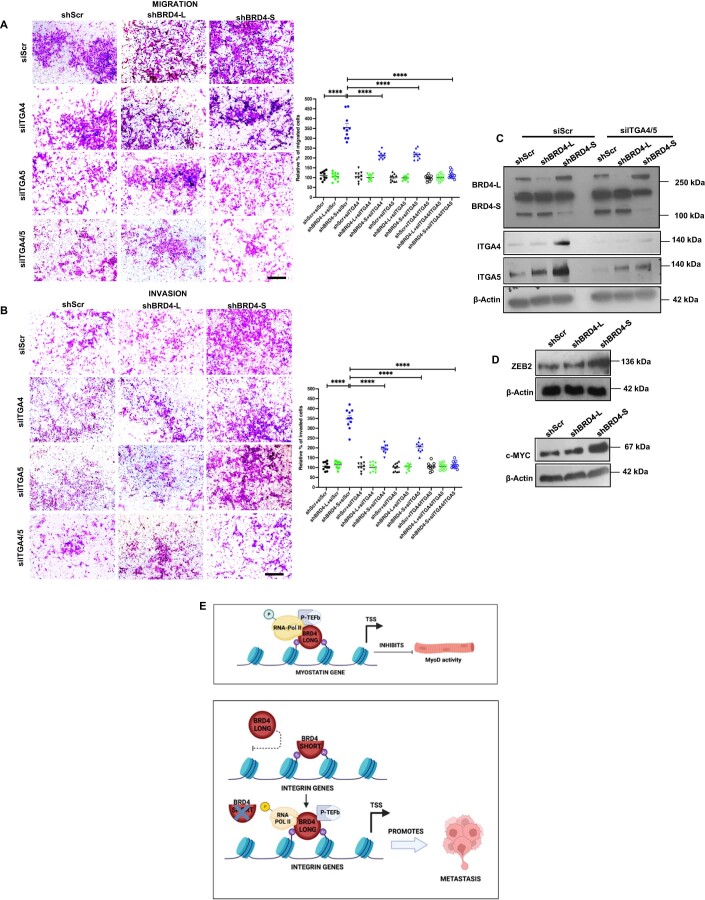
Figure EV5. ITGA4/5 knockdown rescues migration and invasion in shBRD4-S cells.
(A,B) Migration and invasion was analysed by Transwell assays in shScr, shBRD4-L and shBRD4-S by transfecting them with siScr, siITGA4, siITGA5 or siITGA4 and 5. The inserts were stained with crystal violet. Images are representative of at least three biological replicates. Scale bar: 100 μm. Scatter plots indicating the percentage of migration and invasion is shown. Error bars correspond to the average ± SEM (n = 5 biological replicates with 2 technical replicates shown). Two-tailed non-parametric unpaired t test was performed for statistical analysis. ***p ≤ 0.001, ****p ≤ 0.0001. (C) Western blot analysis showing transient ITGA4 and ITGA5 knockdown efficiency in shScr, shBRD4-L and shBRD4-S cells as indicated. β-Actin was used as the loading control. Images are representative of at least three biological replicates. (D) Western blot analysis showing ZEB2 and c-MYC expression in shScr, shBRD4-L and shBRD4-S cells as indicated. β-Actin was used as the loading control. Images are representative of at least two biological replicates. (E) Graphical model summarizing the function of the BRD4 isoforms in ERMS. Source data are available online for this figure.

