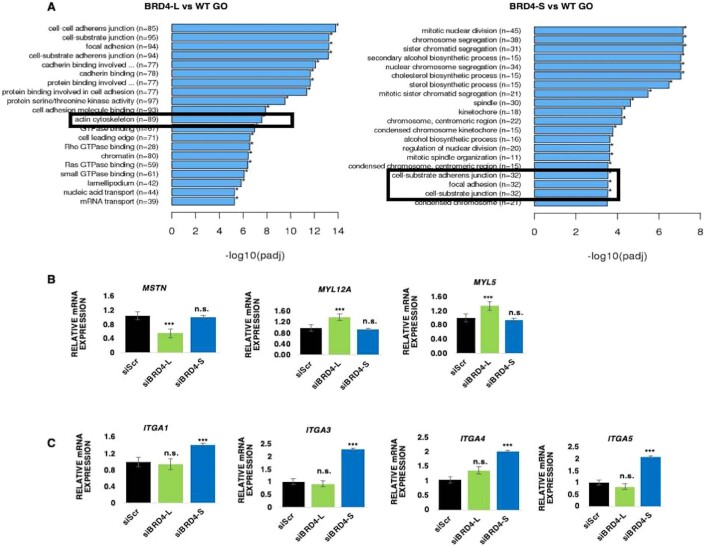
Figure EV4. Validation of BRD4-L and BRD4-S targets.
(A) GO enrichment histogram showing significantly enriched biological processes upon BRD4-L and BRD4-S knockdown based on the number of differentially expressed genes. (B) RT-qPCR analysis of MSTN, MYL12A and MYL5 mRNA in siScr, siBRD4-L and siBRD4-S cells. The values correspond to average ± SEM (n = 4 biological replicates). n.s. = not significant, ***p ≤ 0.001, n.s. not significant. (C) RT-qPCR analysis of the integrin (ITGA1, ITGA3, ITGA4 and ITGA5) mRNA in siScr, siBRD4-L and siBRD4-S cells. The values correspond to average ± SEM (n = 4 biological replicates). Two-tailed non-parametric unpaired t test was performed for statistical analysis. n.s. not significant, ***p ≤ 0.001, n.s. not significant.

