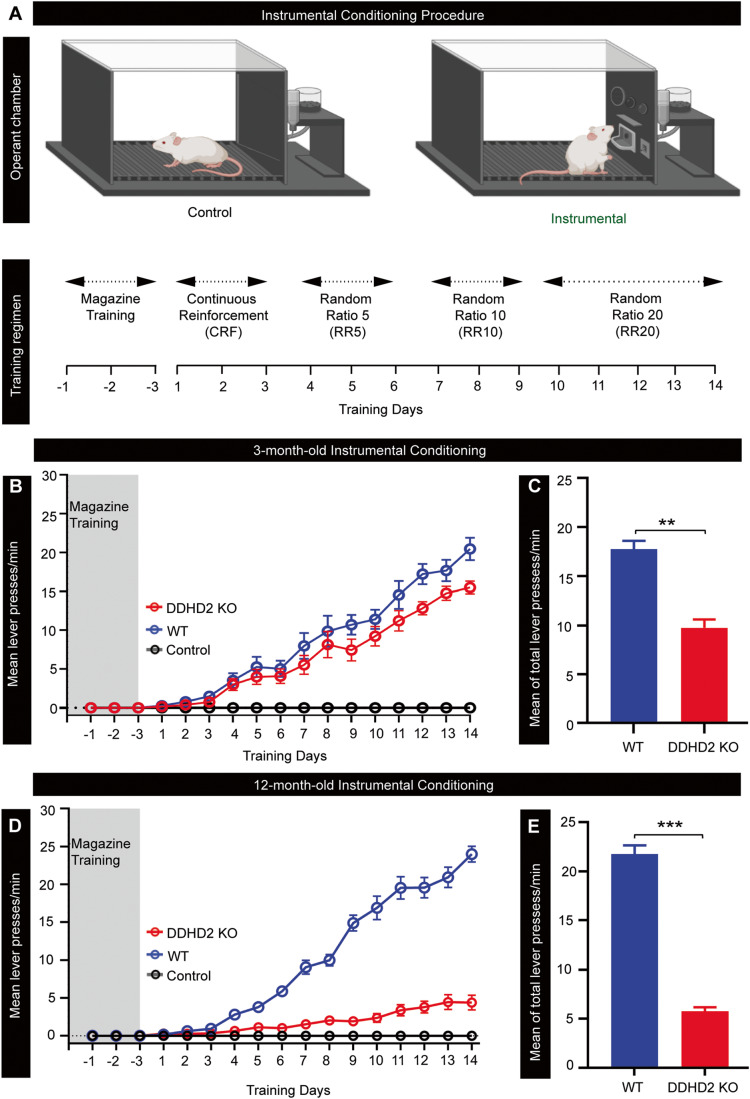
Figure 1. Behavioural responses to instrumental conditioning in DDHD2+/+ vs DDHD2−/− mice.
Instrumental conditioning was performed on cohorts of DDHD2+/+ (WT) or DDHD2−/− (KO) mice vs controls, respectively. (A) Illustration of the procedure for operant lever conditioning in instrumental vs control mice; N = 20 (the figure was created using Biorender.com). (B) Line graph showing mean lever presses per minute in 3mo WT vs KO mice. (C) Bar graph showing mean of total lever presses per minute in DDHD2+/+ vs DDHD2−/− mice at 3mo. (D) Line graph showing mean lever presses per minute in 12mo WT vs KO mice. (E) Bar graph showing mean of total lever presses per minute in DDHD2+/+ vs DDHD2−/− mice at 12mo. Data information: In (C, E), the significance of the difference between each group (n = 20 in each cohort of instrumental and control animals) as determined by unpaired t-test is indicated by asterisks **p < 0.01, ***p < 0.001. Error bars represent the cumulative standard error of the mean (SEM) for all groups and parameters. Source data are available online for this figure.

