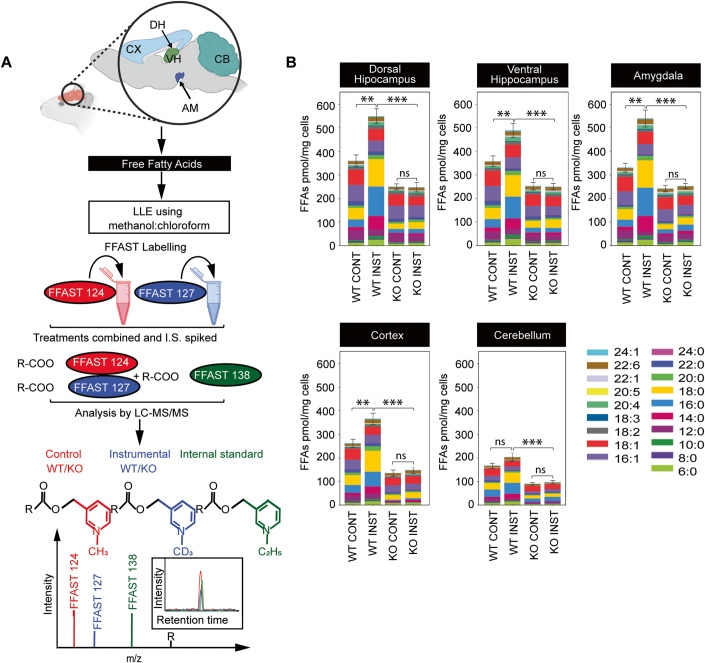
Figure 2. Total FFA levels across different brain regions of 12-month-old instrumentally conditioned DDHD2+/+ vs DDHD2−/− mice.
(A) Schematic workflow for Free Fatty Acid (FFA) extraction from different brain regions including cortex (CX), ventral hippocampus (VH), amygdala (AM), dorsal hippocampus (DH) and cerebellum (CB), and subsequent derivatization using FFAST, and LC-MS/MS analysis. For each brain region, FFAs were extracted from the two different experimental conditions (instrumental or context control mice) and labelled separately at the carboxy-terminus using FFAST for subsequent multiplexing LC-MS/MS analysis, together with FFAST-labelled internal standards (as per Narayana et al, 2015 (Narayana et al, 2015)). This workflow was replicated 6 times, to establish FFA abundance in each of the 6 mice used for each experimental condition. (B) Bar plots showing the profile of 19 FFAs obtained by FFAST LC-MS/MS across 6 brains of 12-month-old control vs instrumentally conditioned DDHD2+/+ vs DDHD2−/− mice with analytes shown by acyl chain composition. Data information: In (B), the significance of the difference between each group (n = 6 biological replicates) as determined by unpaired t-test with Holm–Sidak post hoc correction is indicated by asterisks **p < 0.01, ***p < 0.001, ns = not significant. Error bars represent the cumulative standard error of the mean (SEM) for all groups and parameters. Source data are available online for this figure.

