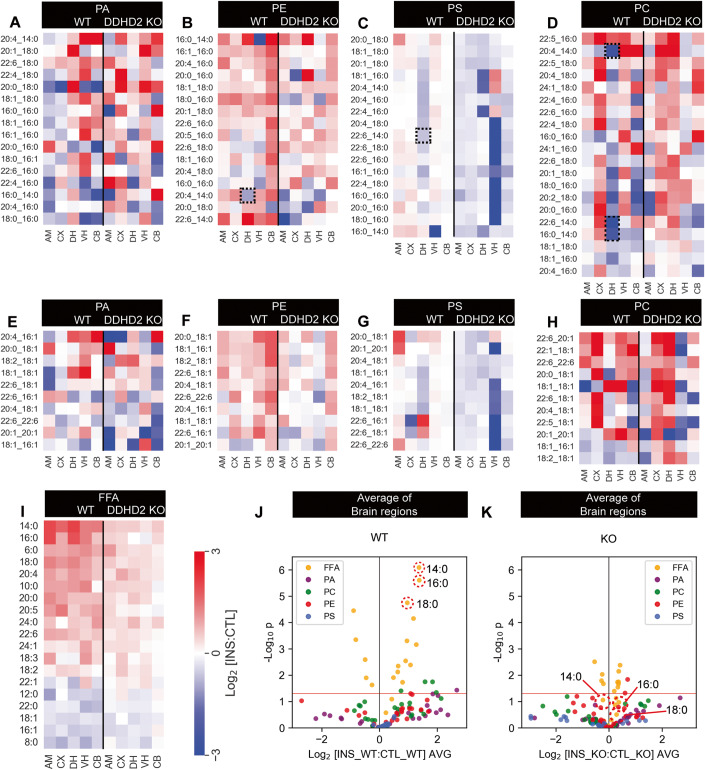
Figure 3. Phospholipid and FFA profile in 12mo mice.
Lipid response to instrumental conditioning across the brain of DDHD2 knockout (KO) and wild type (WT) animals. (A–H) Phospholipid responses (A–D) phospholipids containing C14:0, C16:0 and C18:0 acyl chains. (E–H) phospholipids not containing C14:0, C16:0 and C18:0 acyl chains. (I) Fold-change response of FFAs to instrumental conditioning at 12mo. (J, K) Average response of FFAs and phospholipids across all the brain regions in cohorts of DDHD2+/+ (WT) or DDHD2−/− (KO) mice: AM—central amygdala, CX—Cortex, VH—ventral hippocampus, DH—dorsal hippocampus, CB—cerebellum. Lipids: PA—phosphatidic acid, PC—phosphatidylcholine, PE—phosphatidylethanolamine, PG—phosphatidylglycerol, PS—phosphatidylserine. Dotted boxes show myristoyl-containing phospholipids decreasing in the dorsal hippocampus. Data information: In (A–I), each pixel in the heatmap represents the average change in total abundance of all lipids of a given class across the 6 measured brain regions (n = 6 biological replicates). In (J, K), each dot on the volcano plot represents the average change in abundance of a single lipid analyte across 5 measured brain regions in control vs instrumentally conditioned DDHD2+/+ vs DDHD2−/− mice. Analytes below the red line represent those whose change in abundance was not statistically significant (two-tailed t-test p > 0.05). Source data are available online for this figure.

