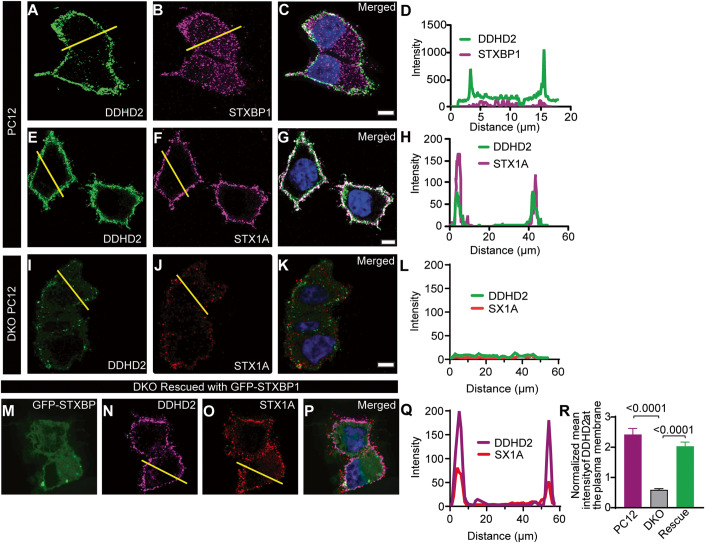
Figure 5. STXBP1 (Munc18-1) plays a key role in the transport of DDHD2 to the plasma membrane.
Representative image of BaCl2-stimulated PC12 cells immunostained for (A) endogenous DDHD2 and (B) endogenous STXBP1. The merged image of the channels is shown in (C), and the fluorescence intensity profile of DDHD2 (green) and STXBP1 (magenta) from the indicated yellow line is shown in (D). Representative images of BaCl2-stimulated PC12 cells immunostained for (E) endogenous DDHD2 and (F) endogenous STX1A. The merged image of the channels is shown in (G), and the fluorescence intensity profile of DDHD2 (green) and STX1A (magenta) from the indicated yellow line is shown in (H). Representative images of BaCl2-stimulated STXBP1/2 double knockout (DKO) PC12 cells stained for (I) endogenous DDHD2 and (J) endogenous STX1A. The merged image of the channels is shown in (K), and the DDHD2 intensity with STX1A in DKO PC12 cells is shown in (L). DKO PC12 cells following rescue with GFP-STXBP1 is shown in (M–P). (Q) Quantification of mean intensity (±SEM) of DDHD2 on the plasma membrane in WT PC12, DKO PC12 cells and DKO PC12 cells rescued with GFP-STXBP1. (R) Normalised mean intensity of DDHD2 on the plasma membrane. Data information: In (R), the significance is tested using ordinary one-way ANOVA multiple comparison test. Scale bars are 5 µm. n = 10–22 cells from 3 independent experiments and error bars represent the cumulative standard error of the mean (SEM) for all groups and parameters.

