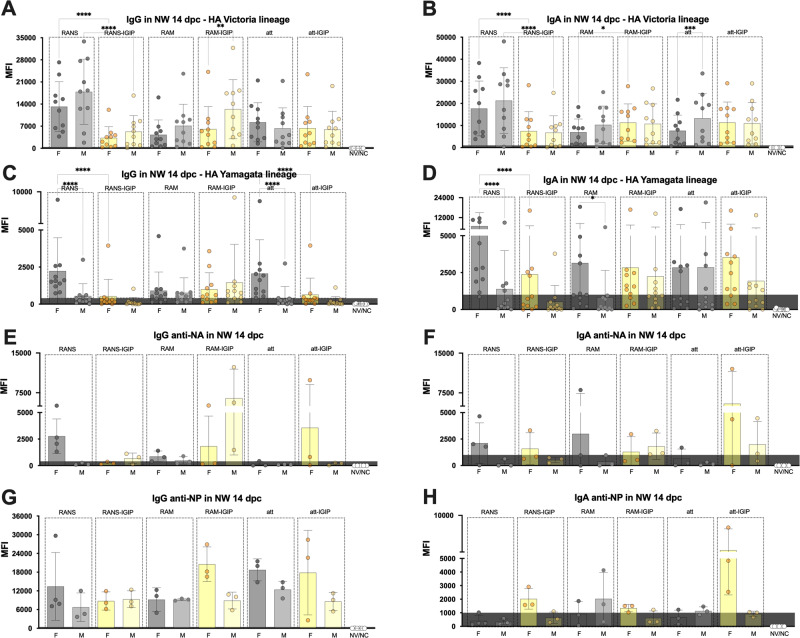
Fig. 7. IgG and IgA in nasal washes at 14 dpc plotted based on biological sex and vaccine type.
A–H Protein microarray reactivity data measured by MFI as described in Fig. 3. Statistical analyses included 2-way ANOVA followed by Tukey’s multiple comparison tests (HA antigens) and/or Brown–Forsythe and Welch ANOVA followed by Dunnett’s T3 multiple comparison tests (NA and NP antigens). Qualitative differences shown by bar graphs and statistical differences noted with asterisks (*) as follows: *p < 0.05, **p < 0.01, ***p < 0.001, ****p < 0.0001, and ns, p ≥ 0.05.

