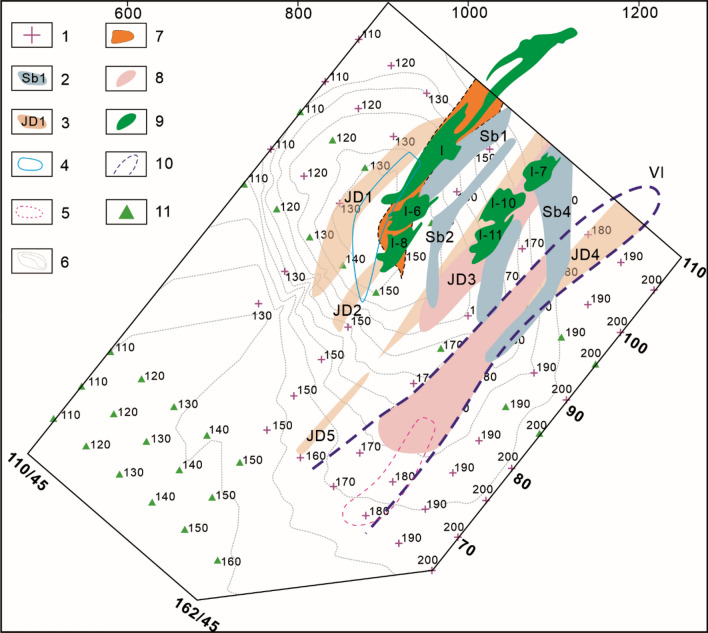
Figure 12.
Comprehensive TEM and IP geophysical prospecting anomalies and planar prediction diagram of the mineralized zones in the Maoping Pb–Zn deposit. 1–IP measuring point; 2–TEM low resistance anomaly; 3–IP high susceptibility anomaly; 4–Inferred orebody horizontal projection from charging point; 5–Apparent charging rate of IP profile; 6–Anomaly at the charging point; 7–Speculated extension position of No. I orebody; 8–Key prospecting target area; 9–Projection of newly discovered orebody; 10–Predicted mineralized zone; 11–Charging measuring point. Comprehensive TEM and IP geophysical prospecting anomalies and planar prediction diagram of the mineralized zones in the Maoping Pb–Zn deposit.
© 2024 by Runsheng Han is licensed under Attribution 4.0 International.

