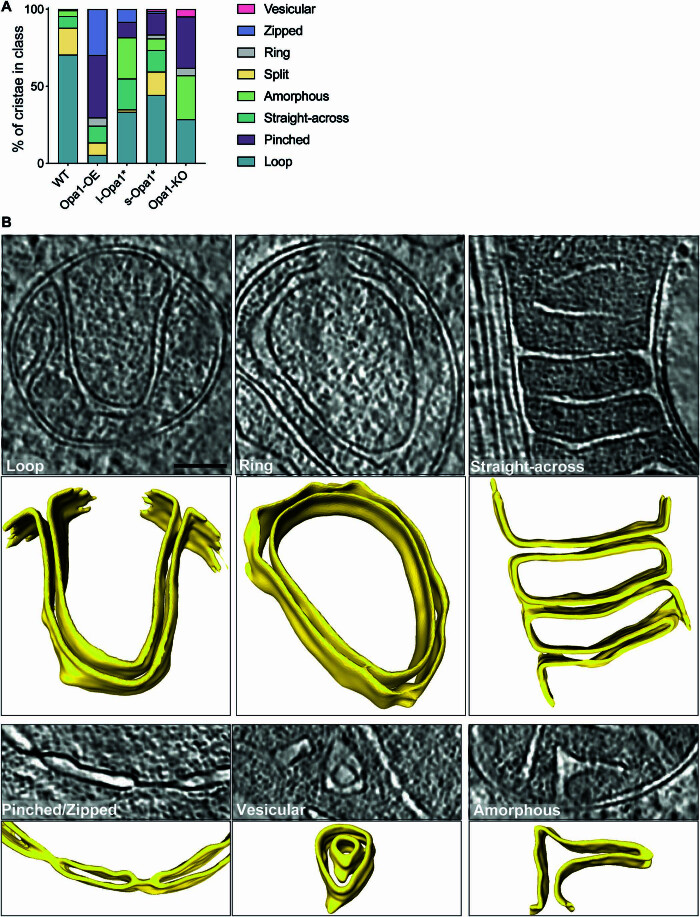
Figure EV4. Unusual cristae morphology.
(A) Graph bar representing the relative proportion of unusual cristae morphology observed in indicated MEF lines. Unusual cristae were categorized into vesicular, zipped, ring, split, amorphous, straight-across, pinched and loop. N refers to number of cristae analyzed, N: wild-type = 222, Opa1-OE = 430, l-Opa1* = 323, s-Opa1* = 653, Opa1-KO = 243. (B) Summed, projected central slices of cryo-electron tomograms showing examples of unusual cristae in mitochondria across cell lines in 2D (top) and 3D (bottom). Loop (from Fig. 1A, s-Opa1*), ring, straight-across (from Fig. 1A, l-Opa1*), pinched (from Appendix Fig. S2A, Opa1-KO second from the left), vesicular (from Fig. 1A, Opa1-KO), and amorphous cristae are shown. Scale bar = 200 nm.

