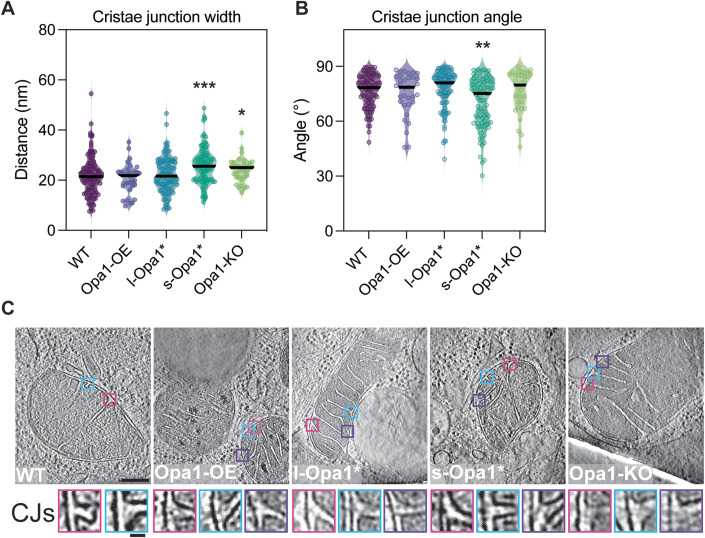
Figure 3. Quantification of cristae junction (CJ) properties.
(A) Plot of measured cristae junction width across cell lines. (see Appendix Fig. S3C,D and “Methods” section for measurement methods). N refers to number of cristae analyzed: WT = 103, Opa1-OE = 33, l-Opa1* = 107, s-Opa1* = 92, Opa1-KO = 34. (B) Plot of measured cristae junction angle across cell lines (see Appendix Fig. S3C,D and “Methods” section for measurement methods). N refers to number of cristae analyzed: WT = 103, Opa1-OE = 33, l-Opa1* = 107, s-Opa1* = 92, Opa1-KO = 34. (C) (Top) Summed, projected central slices of cryo-electron tomograms of representative mitochondria analyzed in (A, B) with magnified cristae junction (bottom insets). WT, Opa1-OE, l-Opa1* and Opa1-KO are the same tomograms from Fig. 1A. Scale bar = 100 nm. Inset scale bar = 25 nm. Data information: Scatter plots show data distribution, the mean is marked by a bold black line. Significance of difference is tested relative to wild type using Mann–Whitney test; *p < 0.05, **p < 0.01, ***p < 0.001. Source data are available online for this figure.

