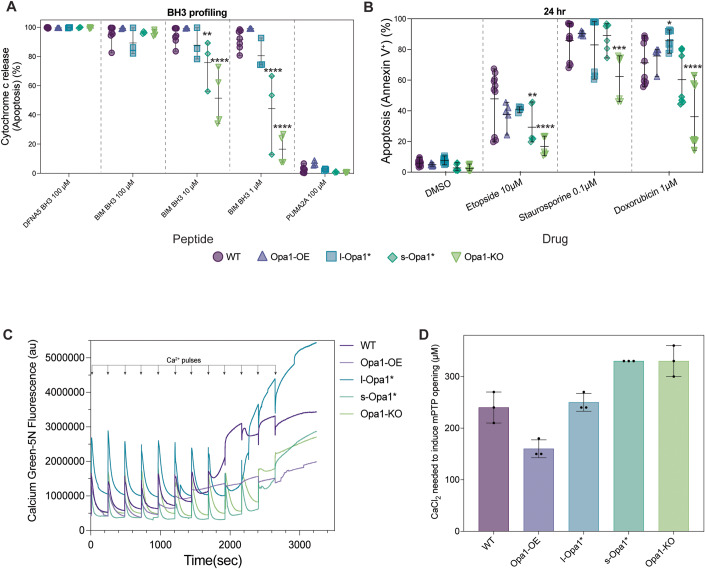
Figure 4. l-Opa1* cells show WT apoptotic priming.
(A) BH3 profiling of MEF lines with BIM BH3 peptide at indicated concentrations compared with positive control DFNA5 and negative control PUMA2A. Error bars represent range of N = 3–4 biological replicates (see methods for description). (B) MEF lines were treated with indicated agents for 24 h and apoptosis was detected via flow cytometry after staining with Annexin V. Error bars represent range of N = minimum 4 biological replicates. (C) Representative traces of mitochondrial calcium retention capacity assays done in indicated MEF lines. (D) Quantification of CaCl2 concentration required to induce mPTP opening in (C). Error bars represent SD from N = 3 biological replicates. Data information: Significance of difference is tested relative to wild-type using the Holm–Sidak’s multiple comparison test; *p < 0.05, **p < 0.01, ***p < 0.005, ****p < 0.0001. Source data are available online for this figure.

