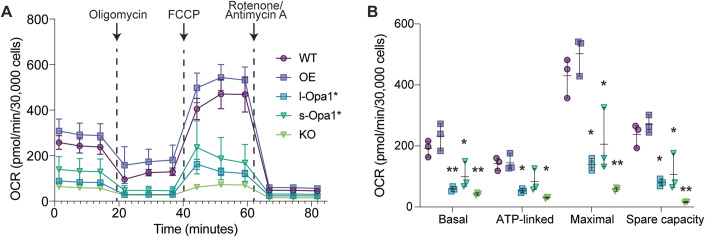
Figure 5. Defects to mitochondrial functions are observed in cells with altered Opa1 levels.
(A) OCR plotted against time with the addition of each compound indicated by an arrow for oligomycin (2 µM), FCCP (1 µM), and rotenone/antimycin A (0.5 µM). Error bars represent SD from N = 3 biological replicates. (B) Aspects of mitochondrial respiration; basal respiration rates, the amount of respiration used for ATP production, maximum respiration and spare capacity, are extracted by the data plotted in (A). Error bars represent range for N = 3 biological replicates. Data Information: Significance of difference is tested relative to WT using Welch’s t test; *p < 0.05, **p < 0.01. Source data are available online for this figure.

