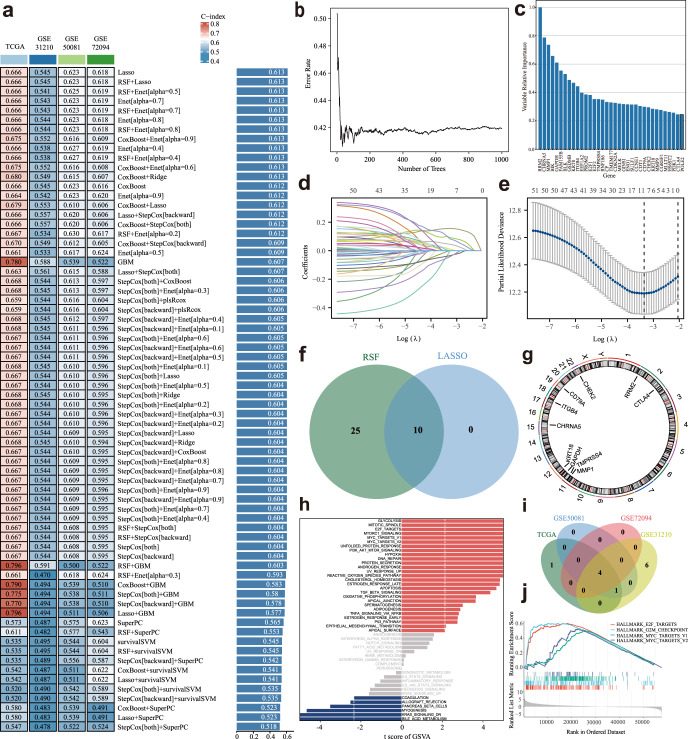
Fig. 3. A consensus PCDI was developed and validated via the machine learning-based integrative procedure.
a A total of 70 kinds of prediction models via a ten-fold cross-validation framework further calculated the C index of each model. b The error rate of the RSF result. c The variable relative importance of screened genes based on RSF. d, e Visualization of LASSO regression in the TCGA-LUAD cohort. The optimal λ was obtained when the partial likelihood of deviance reached the minimum value. f Venn plot of LASSO results and RSF results. g Circos plot depicting the locations and expression levels of 10 model genes. h GSVA of the subgroups categorized by PCDI. i Venn plot of enrichment biological functions among the TCGA cohort, GSE31210 cohort, GSE50081, and GSE72094 cohort. j The 4 common biological pathways.

