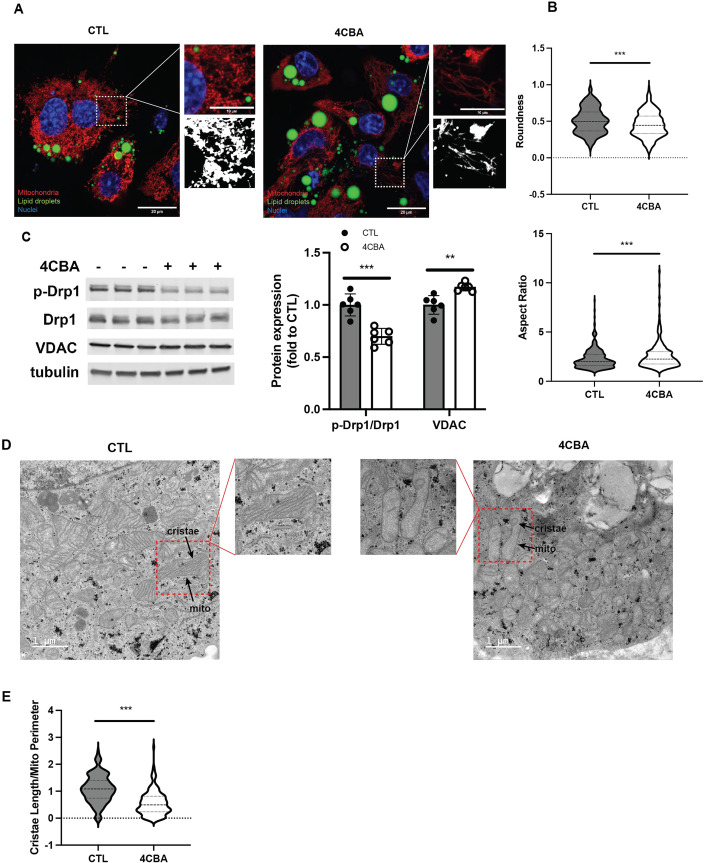
Figure 2. CoQ deficiency affects mitochondrial morphology in brown adipocytes.
(A) Brown adipocyte with vehicle (CTL) or 4CBA treatment were stained with MitoTracker deep red, bodipy and dapi and visualized using the Zeiss LSM710, scale bar = 20 µm. (B) The roundness and aspect ratio of the visualized mitochondria were assessed using Fiji from 2 independent experiments. (C) Phosphorylation of Drp1 was assessed and quantified using western blot, n = 6. (D) Mitochondrial morphology of brown adipocytes with treatment was visualized using TEM with the Tecnai-12, scale bar = 1 µm. (E) Cristae Length/Mito Perimeter of visualized mitochondria were assessed using Fiji from 3 independent experiments. Data information: (C) Data are mean ± SEM. (B, C, E) Results were compared using an unpaired two-tailed Student’s t test. Significance presented at **P < 0.01, and ***P < 0.001 compared to controls. Data describes biological replicates. Source data are available online for this figure.

