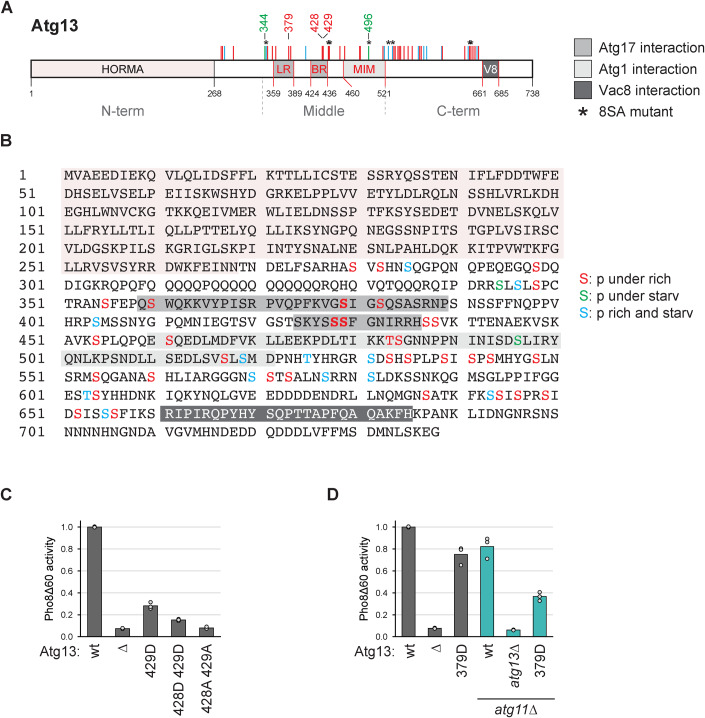
Figure 1. Identification of multiple phosphorylations on Atg13 by mass spectrometry.
(A, B) Cartoon and sequence of Atg13 depicting phosphorylation sites identified by mass spectrometry. Sites present under nutrient-rich conditions and downregulated upon starvation are depicted in red, and sites upregulated upon starvation are in green. Sites present irrespective of the nutrient state are shown in blue. LR, BR: Atg17 binding regions; MIM: Atg1 interaction region; V8: Vac8 binding region. (C) Atg13wt pho8∆60, atg13∆ pho8∆60, Atg13429D pho8∆60, Atg13428D429D pho8∆60 or Atg13428A429A pho8∆60 cells were starved for 4 h. Pho8∆60 alkaline phosphatase activity was measured in three independent experiments. The values of each replicate (circles) and mean (bars) were plotted. All values were normalized to the mean Pho8Δ60 alkaline phosphatase activity of Atg13wt pho8∆60 cells. (D) atg13∆ pho8∆60, atg11∆ atg13∆ pho8∆60, Atg13wt pho8∆60, Atg13379D pho8∆60, Atg13wt atg11∆ pho8∆60 or Atg13379D atg11∆ pho8∆60 cells were starved for 4 h. Pho8∆60 alkaline phosphatase activity was measured in three independent experiments. The values of each replicate (circles) and mean (bars) were plotted. All values were normalized to the mean Pho8Δ60 alkaline phosphatase activity of Atg13wt pho8∆60 cells. Source data are available online for this figure.

