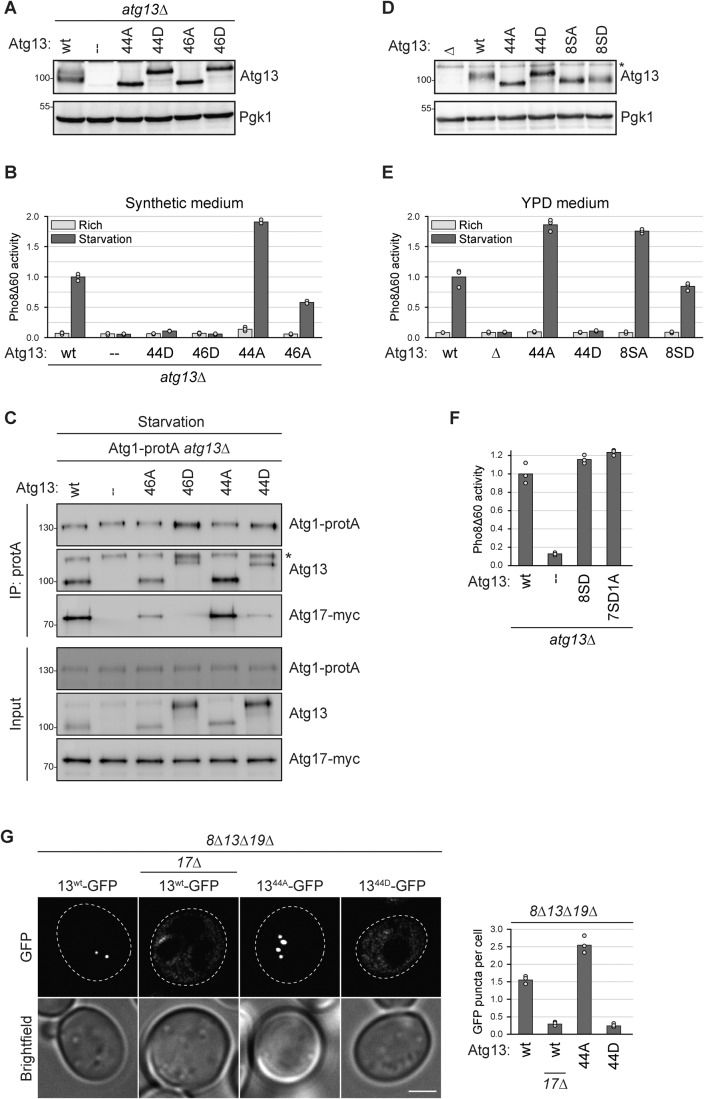
Figure 2. The mutation of 46 in vivo phosphorylation sites on Atg13 enables mimicking reciprocal autophagy states.
(A) atg13∆ pho8∆60 cells containing plasmid expressed Atg13wt, Atg1344A, Atg1346A, Atg1344D, Atg1346D or an empty plasmid were grown to log phase, and cell extracts were prepared by TCA precipitation. Expression levels of proteins were analyzed by anti-Atg13 and anti-Pgk1 western blotting. One representative experiment out of two is shown. (B) atg13∆ pho8∆60 cells containing plasmid expressed Atg13wt, Atg1344D, Atg1346D, Atg1344A, Atg1346A or empty plasmid were grown in synthetic medium to log phase and starved for 4 h. Pho8∆60 alkaline phosphatase activity was measured in three independent experiments. The values of each replicate (circles) and mean (bars) were plotted. All values were normalized to the mean Pho8Δ60 alkaline phosphatase activity of cells expressing Atg13wt. (C) Atg1-protA Atg17-myc atg13∆ cells containing plasmid expressed Atg13wt, Atg1346A, Atg1346D, Atg1344A, Atg1344D or an empty plasmid were starved for 1 h. Atg1-protA was immunoprecipitated using IgG beads, and immunoprecipitates were analyzed by anti-protein A (PAP), anti-Atg13, and anti-myc western blotting. Asterisk: non-specific band. One out of four independent biological replicates is shown. (D) atg13∆ pho8∆60, Atg13wt pho8∆60, Atg1344A pho8∆60, Atg1344D pho8∆60, Atg138SA pho8∆60 or Atg138SD pho8∆60 cells were grown to log phase, and cell extracts were prepared by TCA precipitation. Expression levels of proteins were analyzed by anti-Atg13 and anti-Pgk1 western blotting. Asterisk: non-specific band. One out of two independent biological replicates is shown. (E) Atg13wt pho8∆60, atg13∆ pho8∆60, Atg1344A pho8∆60, Atg1344D pho8∆60, Atg138SA pho8∆60 or Atg138SD pho8∆60 cells were grown in YPD medium to log phase and starved for 4 h. Pho8∆60 alkaline phosphatase activity was measured in three independent experiments. The values of each replicate (circles) and mean (bars) were plotted. All values were normalized to the mean Pho8Δ60 alkaline phosphatase activity of Atg13wt pho8∆60 cells. (F) atg13∆ pho8∆60 cells containing plasmid expressed Atg13wt, Atg138SD, Atg137SD1A, or an empty plasmid were starved for 4 h. Pho8∆60 alkaline phosphatase activity was measured in three independent experiments. The values of each replicate (circles) and mean (bars) were plotted. All values were normalized to the mean Pho8Δ60 alkaline phosphatase activity of cells expressing Atg13wt. (G) atg8∆ atg13∆ atg19∆ or atg8∆ atg13∆ atg17∆ atg19∆ cells containing plasmid expressed Atg13wt-GFP, Atg1344A-GFP or Atg1344D-GFP were starved for 30 min and analyzed by fluorescence microscopy. GFP puncta per cell were quantified in three independent experiments. For each strain and replicate at least 100 cells were analyzed. Scale bar: 2 µm. Source data are available online for this figure.

