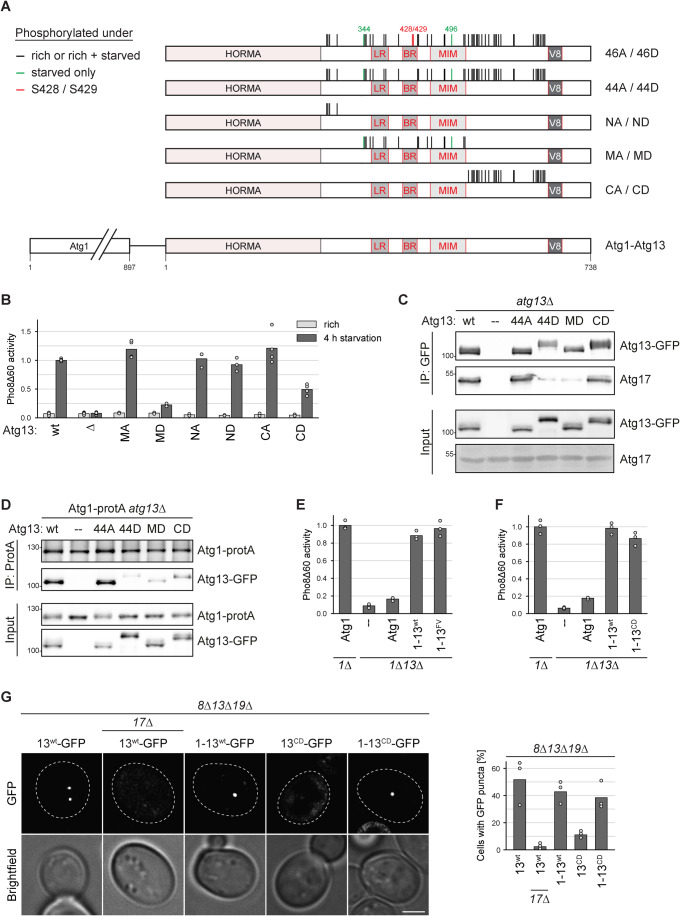
Figure 5. Atg13 C-terminal phosphorylations impact Atg1 interaction in trans and control PAS formation.
(A) Cartoon of Atg13 indicating domain-specific phosphorylation mutants. Black lines indicate phosphorylation sites detected under nutrient-rich conditions only or under nutrient-rich and starvation conditions, red marks S428 and S429, and green depict phosphorylation sites only found under starvation. The latter sites were mutated reciprocally in the respective mutants. (B) Atg13wt pho8∆60, atg13∆ pho8∆60, Atg13MA pho8∆60, Atg13MD pho8∆60, Atg13NA pho8∆60, Atg13ND pho8∆60, Atg13CA pho8∆60, and Atg13CD pho8∆60 cells were grown to log phase and starved for 4 h. Pho8∆60 alkaline phosphatase activity was measured in three independent experiments. The values of each replicate (circles) and mean (bars) were plotted. All values were normalized to the mean Pho8Δ60 alkaline phosphatase activity of Atg13wt pho8∆60 cells. (C) Atg1-protA atg13∆ cells containing plasmid expressed Atg13wt-GFP (wt), Atg1344A-GFP, Atg1344D-GFP, Atg13MD-GFP, Atg13CD-GFP or an empty plasmid were starved for 1 h. GFP-tagged proteins were immunoprecipitated and the amount of precipitated Atg13 and co-precipitating Atg17 was analyzed by anti-GFP and anti-Atg17 western blotting. One out of three independent biological replicates is shown. (D) Atg1-protA atg13∆ cells containing plasmid expressed Atg13wt-GFP (wt), Atg1344A-GFP, Atg1344D-GFP, Atg13MD-GFP, Atg13CD-GFP or an empty plasmid were starved for 1 h. Atg1-protA was immunoprecipitated using IgG beads, and immunoprecipitates were analyzed by anti-Atg1 and anti-Atg13 western blotting. One out of two independent biological replicates is shown. (E) atg1∆ pho8∆60 or atg1∆ atg13∆ pho8∆60 cells containing plasmid expressed Atg1, Atg1-13wt, Atg1-13FV or an empty plasmid were starved for 4 h. Pho8∆60 alkaline phosphatase activity was measured in three independent experiments. The values of each replicate (circles) and mean (bars) were plotted. All values were normalized to the mean Pho8Δ60 alkaline phosphatase activity of cells expressing Atg1. The mutants in this experiment were analyzed in parallel with the mutants shown in Fig. 6A. Therefore, the data for the control samples and the Atg1-13wt fusion are the same. (F) atg1∆ pho8∆60 or atg1∆ atg13∆ pho8∆60 cells containing plasmid expressed Atg1, Atg1-13wt, Atg1-13CD or an empty plasmid were starved for 4 h. Pho8∆60 alkaline phosphatase activity was measured in three independent experiments. The values of each replicate (circles) and mean (bars) were plotted. All values were normalized to the mean Pho8Δ60 alkaline phosphatase activity of cells expressing Atg1. (G) atg8∆ atg13∆ atg19∆ or atg8∆ atg13∆ atg17∆ atg19∆ cells containing plasmid expressed Atg13wt-GFP, Atg1-13wt-GFP, Atg13CD-GFP or Atg1-13CD-GFP were starved for 30 min and analyzed by fluorescence microscopy. The percentage of cells with GFP puncta was quantified in three independent experiments. For each strain and replicate at least 100 cells were analyzed. Scale bar: 2 µm. Source data are available online for this figure.

