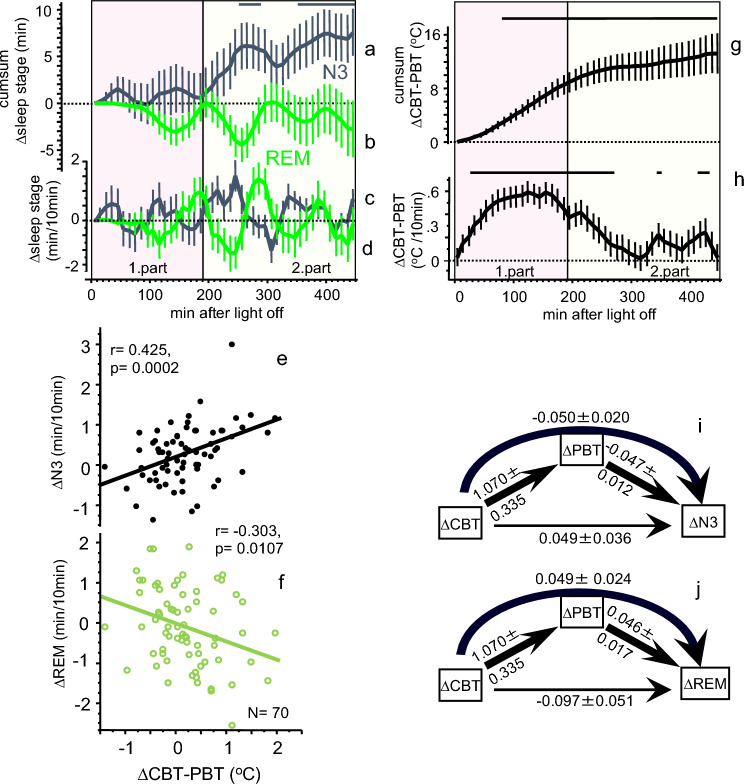
Figure 2.
Relationship between changes in temperatures and sleep stages. Upper panel (a-d, g & h) From top to bottom, time courses (mean ± SEM; 45 × 10 min intervals, N = 72) of the cumulative sum of ∆N3 (a) and the cumulative sum of ∆REM (b) are shown, the time courses of ∆N3 (c) and ∆REM (d) are shown (N3, black curves; REM, green curves). Figure (g) and (h) shows the corresponding time courses for the CBT-PBT gradient (N = 70; ∆ = HM–LM). The heterogeneity of the treatment effects is depicted in the (e,f). Significant FDR post-hoc’s per time interval are displayed in horizontal black lines on top of the Figs. 1a,g,h (HM-LM, p < 0.05, ANOVA table see Suppl. Table 1b). The zero (dotted) line represents the LM condition. The pink area indicates the first and the yellow area of the second part of the night. Lower panel (e,f,i,j): Significant linear correlation between mattress induced effects in ∆CBT-PBT and ∆N3 ((e), r = 0.425, p = 0.0002) and ∆CBT-PBT and ∆REM ((f), r = − 0.303, p = 0.0107) for the second part of the sleep phase (190–450 min after lights off). No such correlations were found for the first part of the night (0–190 min after light off, Table 2). Results of the mediation analysis of the mattress induced effects (∆, HM-LM) are shown as path diagrams of the variables ∆CBT, ∆PBT and ∆N3 (i), and ∆CBT, ∆PBT and ∆REM (j) for the second part of the night (190–450 min). Path coefficients ± SEM are presented beside the path arrows. Significant paths are indicated by thick arrows (p < 0.05), the thin line represents a non-significant path (for statistics see Suppl. Tables 2 & 3). ∆CBT influences ∆N3 and ∆REM mainly via an indirect path through the mediator variable ∆PBT indicated by the curved arrows.

