Figure 3.
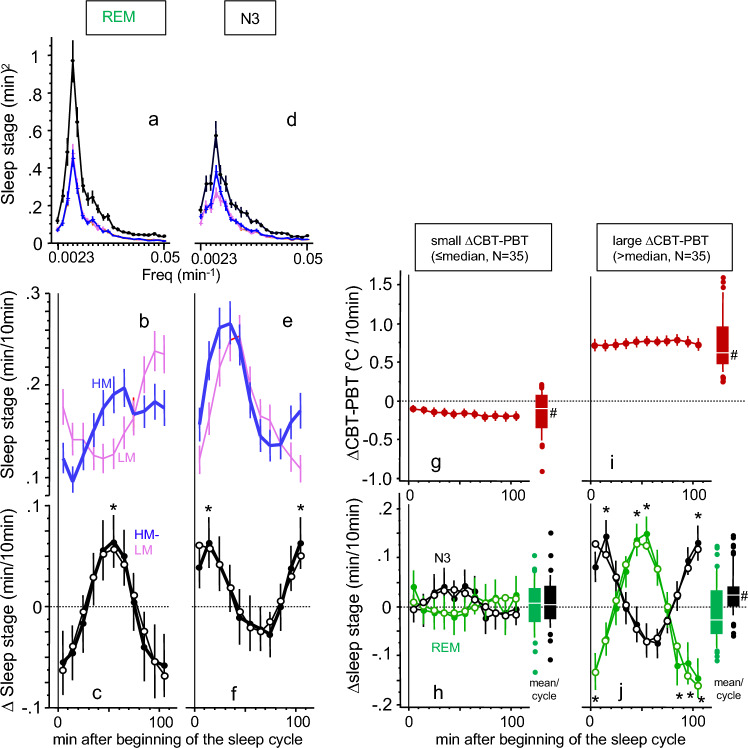
Temperature changes lead to modifications of the sleep cycle. Left panel (a,d). Power spectra of the Fourier-transformed nocturnal time courses (44 × 10 min intervals, see Fig. 1) of sleep stage REM (a) and N3 (d) are shown for mattress condition HM (blue curves), LM (pink curves) and HM-LM (black curves). Frequencies are expressed as 1/period (min-1, abscissa), spectral power (squared amplitude) is expressed as (min/10 min)2 (ordinate) (N = 72, mean ± SEM). Left panel (b,e). The time courses of REM (b) and N3 (e) are shown over the averaged 110 min sleep cycle (N = 72, mean ± SEM; 10 min intervals) for HM (blue curves) and LM (pink curves). Significant differences between HM and LM see in Figure (c) and (f). Left panel (c,f). HM-LM (∆) values for REM (c) and N3 (f) is shown over the averaged sleep cycle (N = 72, mean ± SEM; 11 × 10 min intervals, statistics see (b) and (e)). The zero (dotted) line indicates the LM condition. Significant differences at a given time point between HM and LM are indicated by asterisks (FDR post-hoc’s, p < 0.05). Cosine fit curves for N3 (c) and REM (f) are superimposed (open dots). Right panel (g,i). Time courses of ∆CBT-PBT is depicted over the averaged sleep cycle (N = 70, mean ± SEM; 11 × 10 min intervals, ocher colored curves). The sample is median splitted in individuals showing a small ((g), left) or large ((i), right) HM-LM difference in nocturnal mean values of ∆CBT-PBT. The zero (dotted) line represents the LM condition. The Box and Whiskers plots on the right side of Fig. 3(g) and (i) show the range of all data points of the mean sleep cycle values (center white line: median; box limits: upper and lower quartiles; whisker limits: 10th and 90th percentile; points: outliers). #Indicates significant differences between HM and LM, p < 0.05, see Suppl. Table 6. Right panel (h,j). Similar to Figure (g) and (i) the ∆CBT-PBT median splitted sample is shown for ∆REM (green curves) and ∆N3 (black curves) over the averaged 110 min sleep cycle. Asterisks indicate significant differences between HM and LM at a certain time point ((j), FDR post hocs, p < 0.02). The zero (dotted) line represents the LM condition. Cosine fit curves for the median divided subgroups are superimposed (open dots). The Box and Whiskers plots on the right side of Figure (h) and (j) show the range of all data points of the mean sleep cycle values (center white line: median; box limits: upper and lower quartiles; whisker limits: 10th and 90th percentile; points: outliers). #Indicates significant differences between HM and LM, p < 0.05, see Suppl. Table 6.

