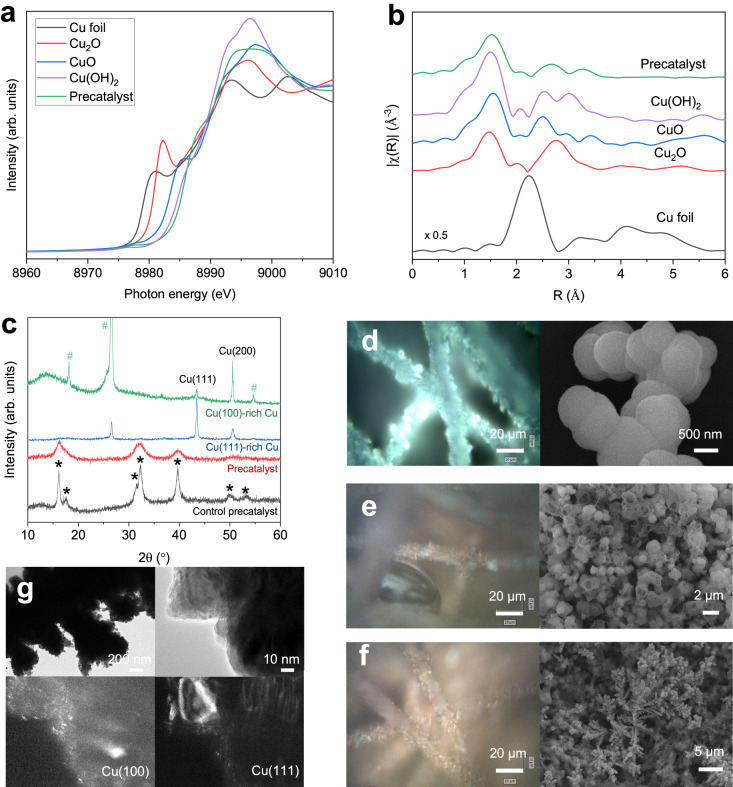
Fig. 2. Structural characterization of Cu precatalyst and derived Cu catalyst.
The Cu K-edge XANES (a) and Fourier-transformed EXAFS (b) spectra of Cu precatalyst and standards (Cu foil, Cu2O, CuO, and Cu(OH)2). c XRD spectra of precatalysts with and without phosphate and the relevant derived Cu catalysts after reduction; * and # represent diffraction peaks of Cu2(OH)3Cl and carbon paper substrate, respectively. Dark-field microscope images (left) and related SEM images (right) of Cu precatalyst after electrolysis at different reduction times, i.e. 0 min (d), 15 min (e), and 30 min (f). g Bright-field (top) and dark-field (bottom) TEM images of the Cu(100)-rich catalyst.

