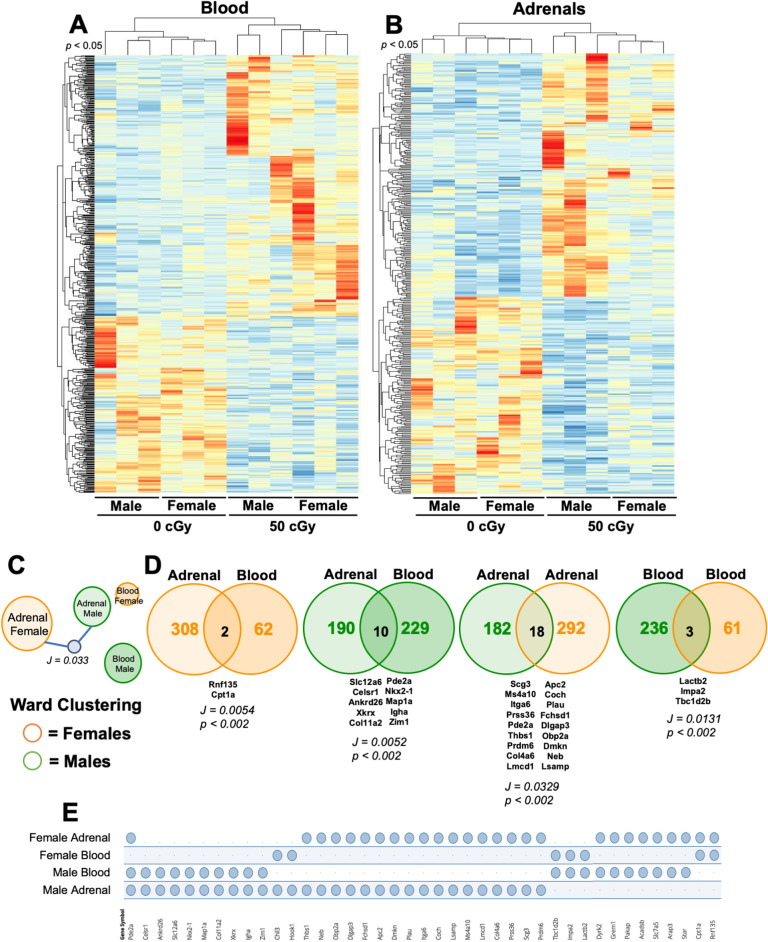
Figure 5.
Sex- and dose-specific RNA sequencing profiles. Male and female mice were exposed to GCRsim (0 and 50 cGy) and at 14-days post-irradiation blood and adrenal glands were isolated and total RNA sequencing was performed. 50 cGy male and females were compared to 0 cGy sham controls. Heatmap of differentially expressed genes (DEG) in blood (A) and adrenal glands (B) from male and female mice exposed to 50 cGy versus 0 cGy controls (log2 fold change > 2 and p-value < 0.05). (C) Ward Clustering forceTree with Jaccard similarity child node (J = 0.033, p < 0.002) is displayed. (D) Venn diagrams of compared annotated datasets with overlapping Jaccard similarity score. (E) Jaccard similarity overlapping annotated genesets intersecting table displays overlapping genes across all tissue types and sexes. Clustering and geneset overlap (E) results generated using GeneWeaver and Venn diagrams (D) generated using Venny2.1. Data represent p < 0.05 (A, B) and p < 0.01 (C–E), n = 3 per group.

