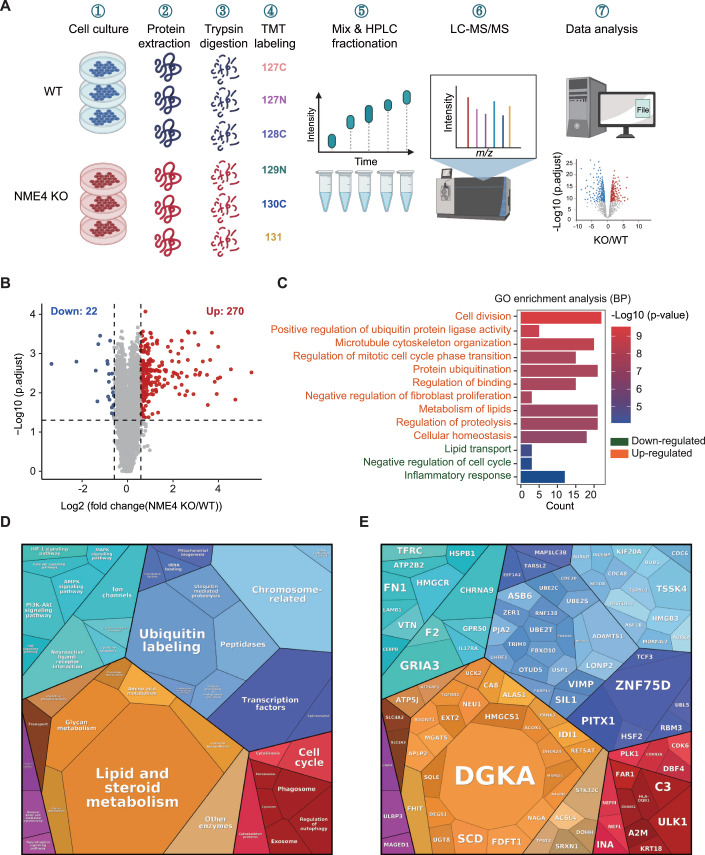
Figure 2. Tandem mass tag-based quantitative proteomics revealed that NME4 functions in lipid metabolism.
(A) Schematic of the tandem mass tag (TMT) 6plex-based quantitative proteomics of WT and NME4-KO cells. (B) Volcano plot showing the levels of proteins in WT and NME4-KO cells. P values was estimated by Student’s t test and adjusted by Benjamini and Hochberg FDR (BH). Biological replicates, n = 3. Proteins whose levels were significantly changed are highlighted (fold change > 1.5, P values ≤ 0.05). (C) Significantly changed proteins in the NME4 knockout group were enriched in biological processes and analyzed in Hitplot. The top ten biological processes enriched by upregulated proteins was shown. P values ≤ 0.05. (D) KEGG pathways of upregulated proteins were mapped using proteomap. (E) Proteins were mapped to the corresponding pathways using proteomap. (D, E) The area of the polygon represents the protein abundance, which was normalized by protein size. Similar colors indicate similar or closely related pathways and proteins. Source data are available online for this figure.

