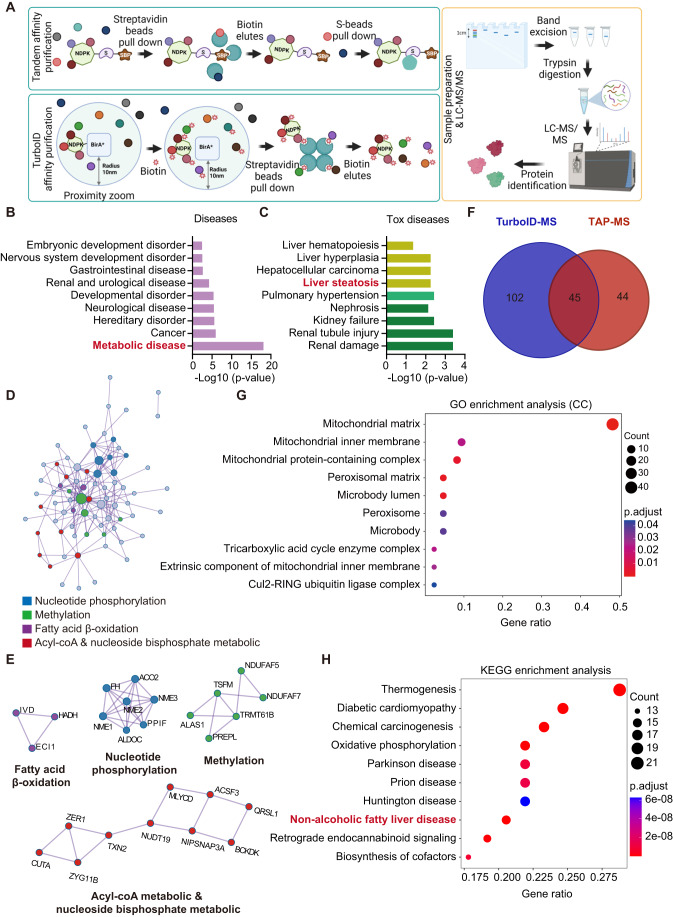
Figure 5. The NME4 protein interaction network revealed its correlation with lipid metabolism and metabolic diseases.
(A) Schematic of the integrated proteomics workflow for establishing the NME4 protein interaction network using tandem affinity purification coupled to mass spectrometry (TAP-MS) or TurboID-MS. (B,C) General (B) and specific (C) diseases were enriched using the high-confidence candidate interacting proteins (HCIPs) that were identified by TAP-MS and performed in IPA software (Ingenuity Pathway Analysis). P values ≤ 0.05 was presented. (D) Pathway network enrichment of HCIPs that were identified by TAP-MS. (E) The top four pathways enriched in (D) with related genes are shown. (F) A Venn diagram showing the overlap between the NME4 interaction networks established by TAP-MS and TurboID-MS. (G,H) Gene Ontology analysis in Cellular Components (CC) (G) and KEGG analysis in diseases (H) was carried out using TurboID-MS HCIPs and performed by Hitplot. P.adjust ≤ 0.05 was significant, P values was adjusted by Benjamini and Hochberg FDR (BH).

