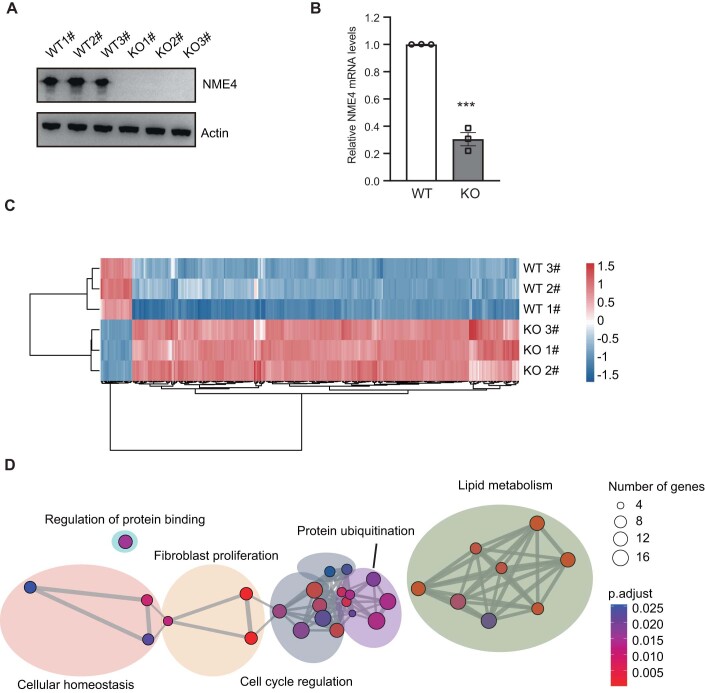
Figure EV2. Tandem mass tag-based quantitative proteomics reveal a correlation between NME4 and lipid metabolism.
(A) Representative western blotting (WB) analysis of NME4 expression in HEK293T stable cell lines. (B) Relative mRNA levels of NME4 in HEK293T WT and stable NME4 knockout cell lines. Biological replicates, n = 3. (C) Heatmap of proteins with significantly altered expression in TMT6-plex quantitative proteomics. (D) Pathway network enrichment of significantly upregulated proteins identified by TurboID-MS and performed using metascape database. P.adjust ≤ 0.05 was cut off which was adjusted by Benjamini and Hochberg FDR (BH). Data information: (B) data are presented as mean ± SEM. ***P values ≤ 0.001 (Student’s t test, unpaired). KO knockout.

