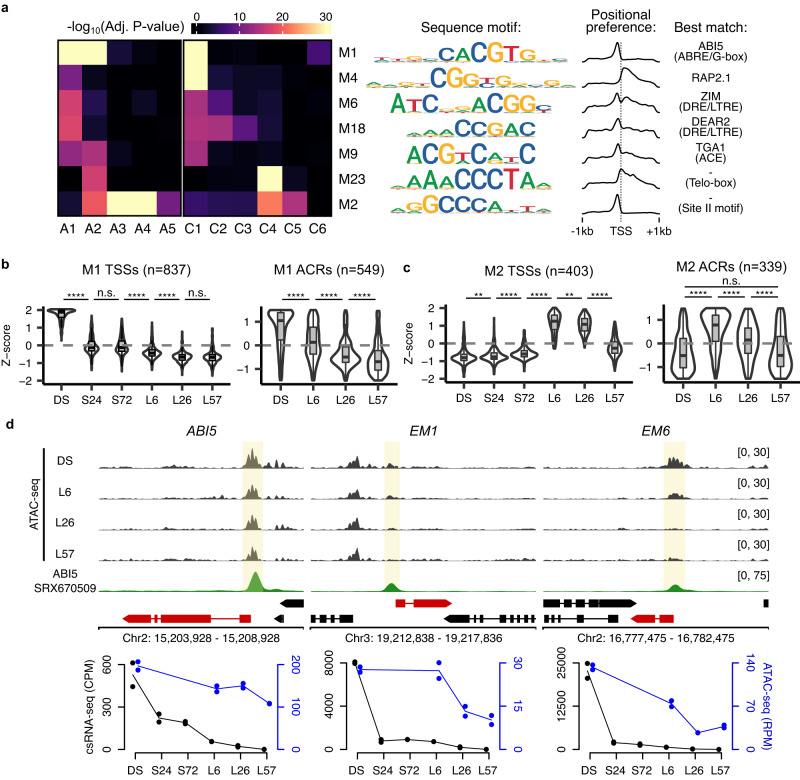
Fig. 3. The timing of ABA sensitivity during germination is regulated by promoter DNA accessibility.
a Enrichment of discovered motifs from the promoters of TSSs found in the csRNA-seq clusters as well as the ACRs found in the ATAC-seq clusters. A heatmap shows the level of enrichment (−log10 adjusted P-value) of the motif in each cluster, with each row representing a unique motif (shown to the right using an information content motif logo). The density of the motifs is shown to demonstrate their positional preference in promoters. The best matching known binding transcription and/or element name is included on the right. P-values were calculated using one-sided Fisher’s exact tests with FDR correction for multiple testing. b, c Violin plots of Z-scores of csRNA-seq and ATAC-seq data for TSSs and their overlapping ACRs, respectively, containing the M1 or M2 motifs. The lower, middle and upper hinges correspond to first quartile, median, and third quartile, respectively. The lower and upper whiskers extend to the minimal/maximal value respectively or 1.5 times the interquartile range, whichever is closer to the median. P-values were calculated using two-sided Mann–Whitney tests with Holm correction for multiple testing (n.s. = not significant, **p < 0.01, ****p < 0.0001). d ATAC-seq and ABI5 DAP-seq113,114 read coverage density tracks for the DS, L6, L26 and L57 time-points for the genes ABI5, EM1, and EM6 (units in RPM). Below these are plotted the corresponding csRNA-seq (in black) and ATAC-seq (in blue) quantification data for the respective TSSs and promoter-associated ACRs.

