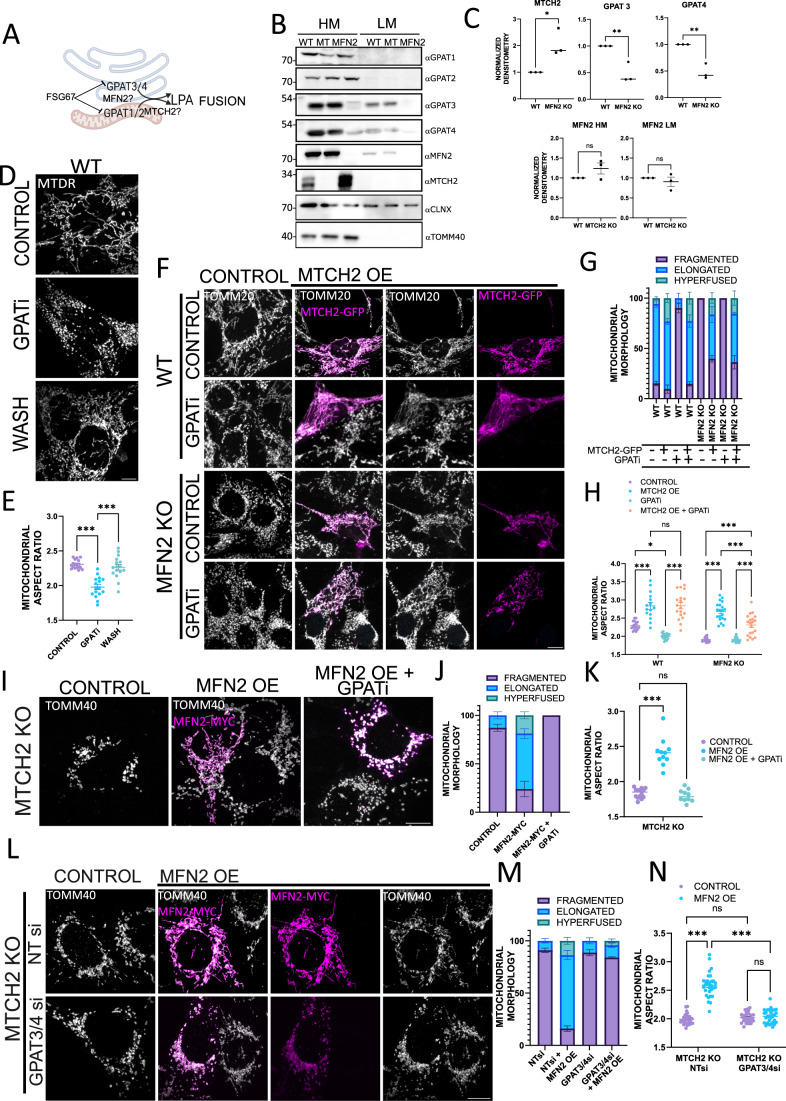
Figure 3. MTCH2 deletion uncovers the requirement of LPA synthesis to sustain mitochondrial fusion enforced by MFN2 overexpression.
(A) Schematic representation of the LPA synthesis machinery. GPATs1/2 synthesize mitochondrial LPA required for phospholipid biosynthesis and for mitochondrial fusion as well. GPATs3/4 synthesize LPA in the ER compartment while LPA synthesis was shown to take place at MAMs. GPATs inhibitor (GPATi) FSG67 inhibits the activity of all of the GPATs and resulting in mitochondrial fragmentation. (B) Western blot analysis of GPATs1-4 in HM and light membrane (LM) fractions of WT, MTCH2 KO (MT), and MFN2 KO MEFs. TOMM40 serves as a HM loading control and calnexin (CLNX) serves as a LM loading control. (C) Upper plots: Densitometry analysis of MTCH2 and GPATs3/4 levels in HM fractions of WT, MFN2 KO MEFs; Lower plots: Densitometry analysis of MFN2 levels in HM and LM fractions of WT and MTCH2 KO MEFs. Band intensities were normalized to loading controls and the averages of three separate measurements are shown. One-way ANOVA statistical analysis and SEM are shown. (D) Representatives images of WT MEFs non-treated (control) or treated for 16 h with 100 μM GPATi −/+ wash, and imaged after 4 h. Mitochondria were labeled with MTDR. Scale bar 10 µm. (E) Mitochondrial aspect ratio analysis. At least 30 fields were analyzed per condition. One-way ANOVA statistical analysis and SEM are shown. (F) Representative images of WT and MFN2 KO MEFs control or overexpressing MTCH2-GFP in non-treated or treated for 16 h with GPATi. Mitochondria were stained with αTOMM20 antibody. Scale bar 10 µm. (G) Classical classification of mitochondrial network morphology. Results are presented as average and SEM of three separate experiments; at least 20 cells were analyzed per condition. (H) Mitochondrial aspect ratio analysis. At least 25 control and 25 transfected cells were analyzed per condition. One-way ANOVA statistical analysis and SEM are shown. (I) Representatives images of MTCH2 KO MEFs control or overexpressing MFN2-MYC in non-treated or treated for 16 h with GPATi. Mitochondria were stained using αTOMM40 antibody. Scale bar 10 µm. (J) Classical classification of mitochondrial network morphology. Results are presented as average and SEM of three separate experiments; at least 20 cells were analyzed per condition. (K) Mitochondrial aspect ratio analysis. At least 25 control and 25 transfected cells were analyzed per condition. One-way ANOVA statistical analysis and SEM are shown. (L) Representatives images of MTCH2 KO MEFs treated with non-targeting (NT) siRNA or with a combination of GPAT3 and GPAT4 siRNAs in control conditions or overexpressing MFN2-MYC. Mitochondria were stained using αTOMM40 antibody. Scale bar 10 µm. (M) Classical classification of mitochondrial network morphology. Results presented as average and SEM of three separate experiments; at least 20 cells were analyzed per condition. (N) Mitochondrial aspect ratio analysis. At least 25 control and 25 transfected cells were analyzed per condition. One-way ANOVA statistical analysis and SEM are shown. Data information: (C,E,H,K,N) ns, not significant, *P < 0.05, **P < 0.01, ***P < 0.001. Source data are available online for this figure.

