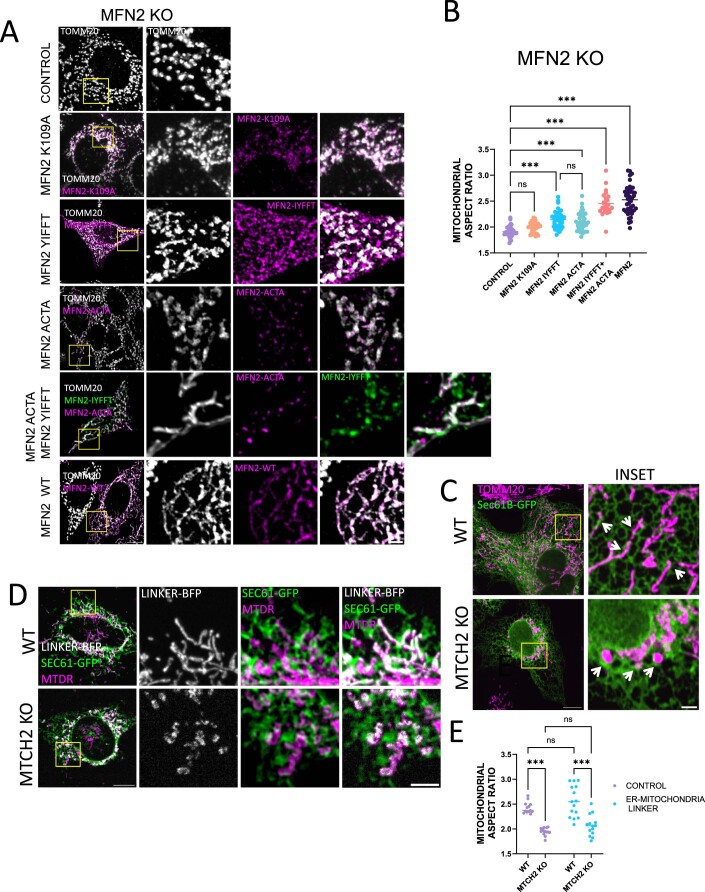
Figure EV2. MFN2’s ability to enforce mitochondrial fusion in MTCH2 KO cells is partially disconnected from its fusion activity.
(A) Representatives images of MFN2 KO MEFs control or transfected with MFN2-K109A-FLAG, MFN2-IYFFT-MYC, MFN2-ACTA-V5, WT MFN2-MYC, or co-transfected with MFN2-IYFFT-MYC and MFN2-ACTA-V5. Mitochondria were stained with αTOMM20 antibody. Scale bar 10 µm; inset scale bar 5 µm. (B) Mitochondrial aspect ratio analysis (at least 25 control and 25 transfected cells were analyzed per condition). One-way ANOVA statistical analysis and SEM are shown. (C) Representative images of WT and MTCH2 KO cells transfected with the ER marker Sec61b-GFP and stained with αTOMM20 antibody. Arrowheads indicate areas of close proximity between ER and mitochondria. Scale bar 10 µm; inset scale bar 2 µm. (D) Representatives images of WT and MTCH2 KO MEFs co-transfected with the ER-mitochondria linker construct AKAP-mtagBFP2-UBC6 and the ER marker Sec61b-GFP. Mitochondria were labeled with MTDR. Scale bar 10 µm; Scale bar inset 5 µm. (E) Mitochondrial aspect ratio analysis. At least 15 control and 15 transfected cells were analyzed per condition. One-way ANOVA statistical analysis and SEM are shown. Data information: (B,E) ns, not significant, ***P < 0.001. Source data are available online for this figure.

