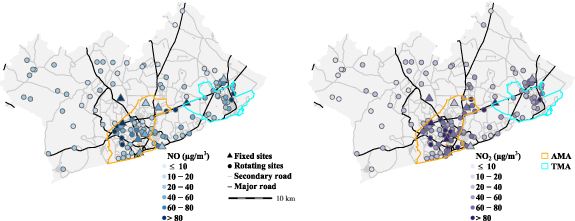
Figure 1.

Map of the Greater Accra Metropolitan Area (GAMA) with locations of ‘fixed’ and ‘rotating’ sites with annual concentrations of (A) NO and (B) NO2. The colors of NO2 concentrations indicate comparison to the new World Health Organization (WHO) annual air quality guideline of 10 μg m−3. The concentrations at the fixed sites represent annual mean values, and the rotating sites represent season-adjusted mean values (i.e. an estimated annual means). Major and secondary road network were from OpenStreetMap [27] (downloaded in 2019).
