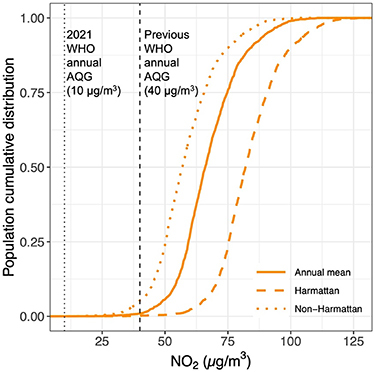
Figure 5.

Cumulative densities of the proportion of AMA population living in enumeration areas (EAs) with varying NO2 concentration relative to the WHO guideline, by annual, Harmattan, and non-Harmattan averages. The population data used was from the 2010 Ghana Census. The vertical black dash/dotted-lines show the previous (40 µg m−3) and the recently revised (10 µg m−3) World Health Organization (WHO) annual air quality guideline (AQG) for NO2.
