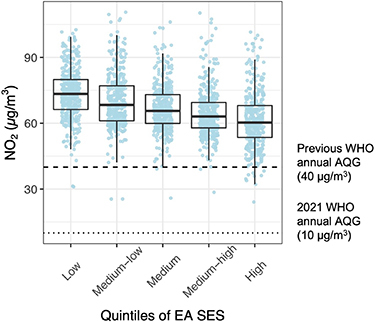
Figure 6.

Distribution of enumeration area (EA) annual mean NO2 concentrations within quintiles (20% increments) of EA socioeconomic status (SES) in the Accra Metropolitan Area (AMA). SES: EA median log equivalized household consumption. The upper and lower limits of the black box represent the interquartile range of the distribution and the horizontal line within the box represents the median. Each colored point represents an EA average NO2 level (µg m−3).
