Figure 2.

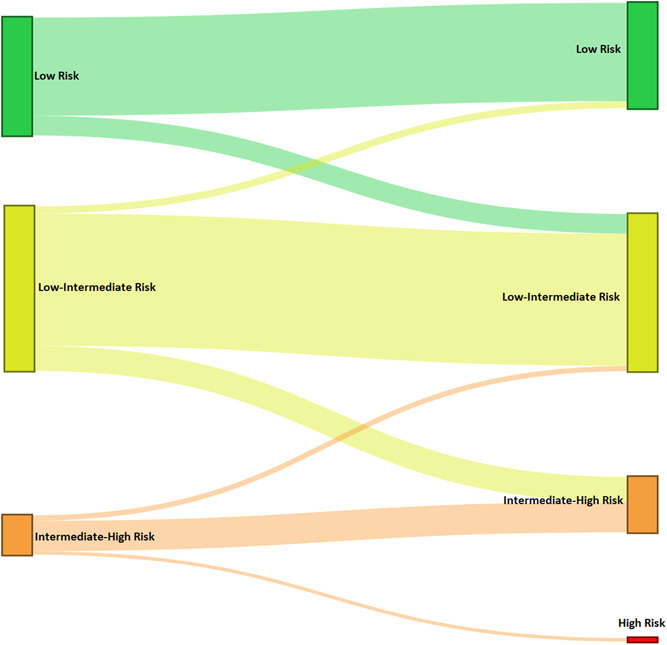
Sankey diagram displaying the flow of patients from initial risk stratification base on the original 4‐strata COMPERA model 2.0 (left) to the modified model including VO2 instead of 6‐min walk distance in the 6MWT (right).

Sankey diagram displaying the flow of patients from initial risk stratification base on the original 4‐strata COMPERA model 2.0 (left) to the modified model including VO2 instead of 6‐min walk distance in the 6MWT (right).