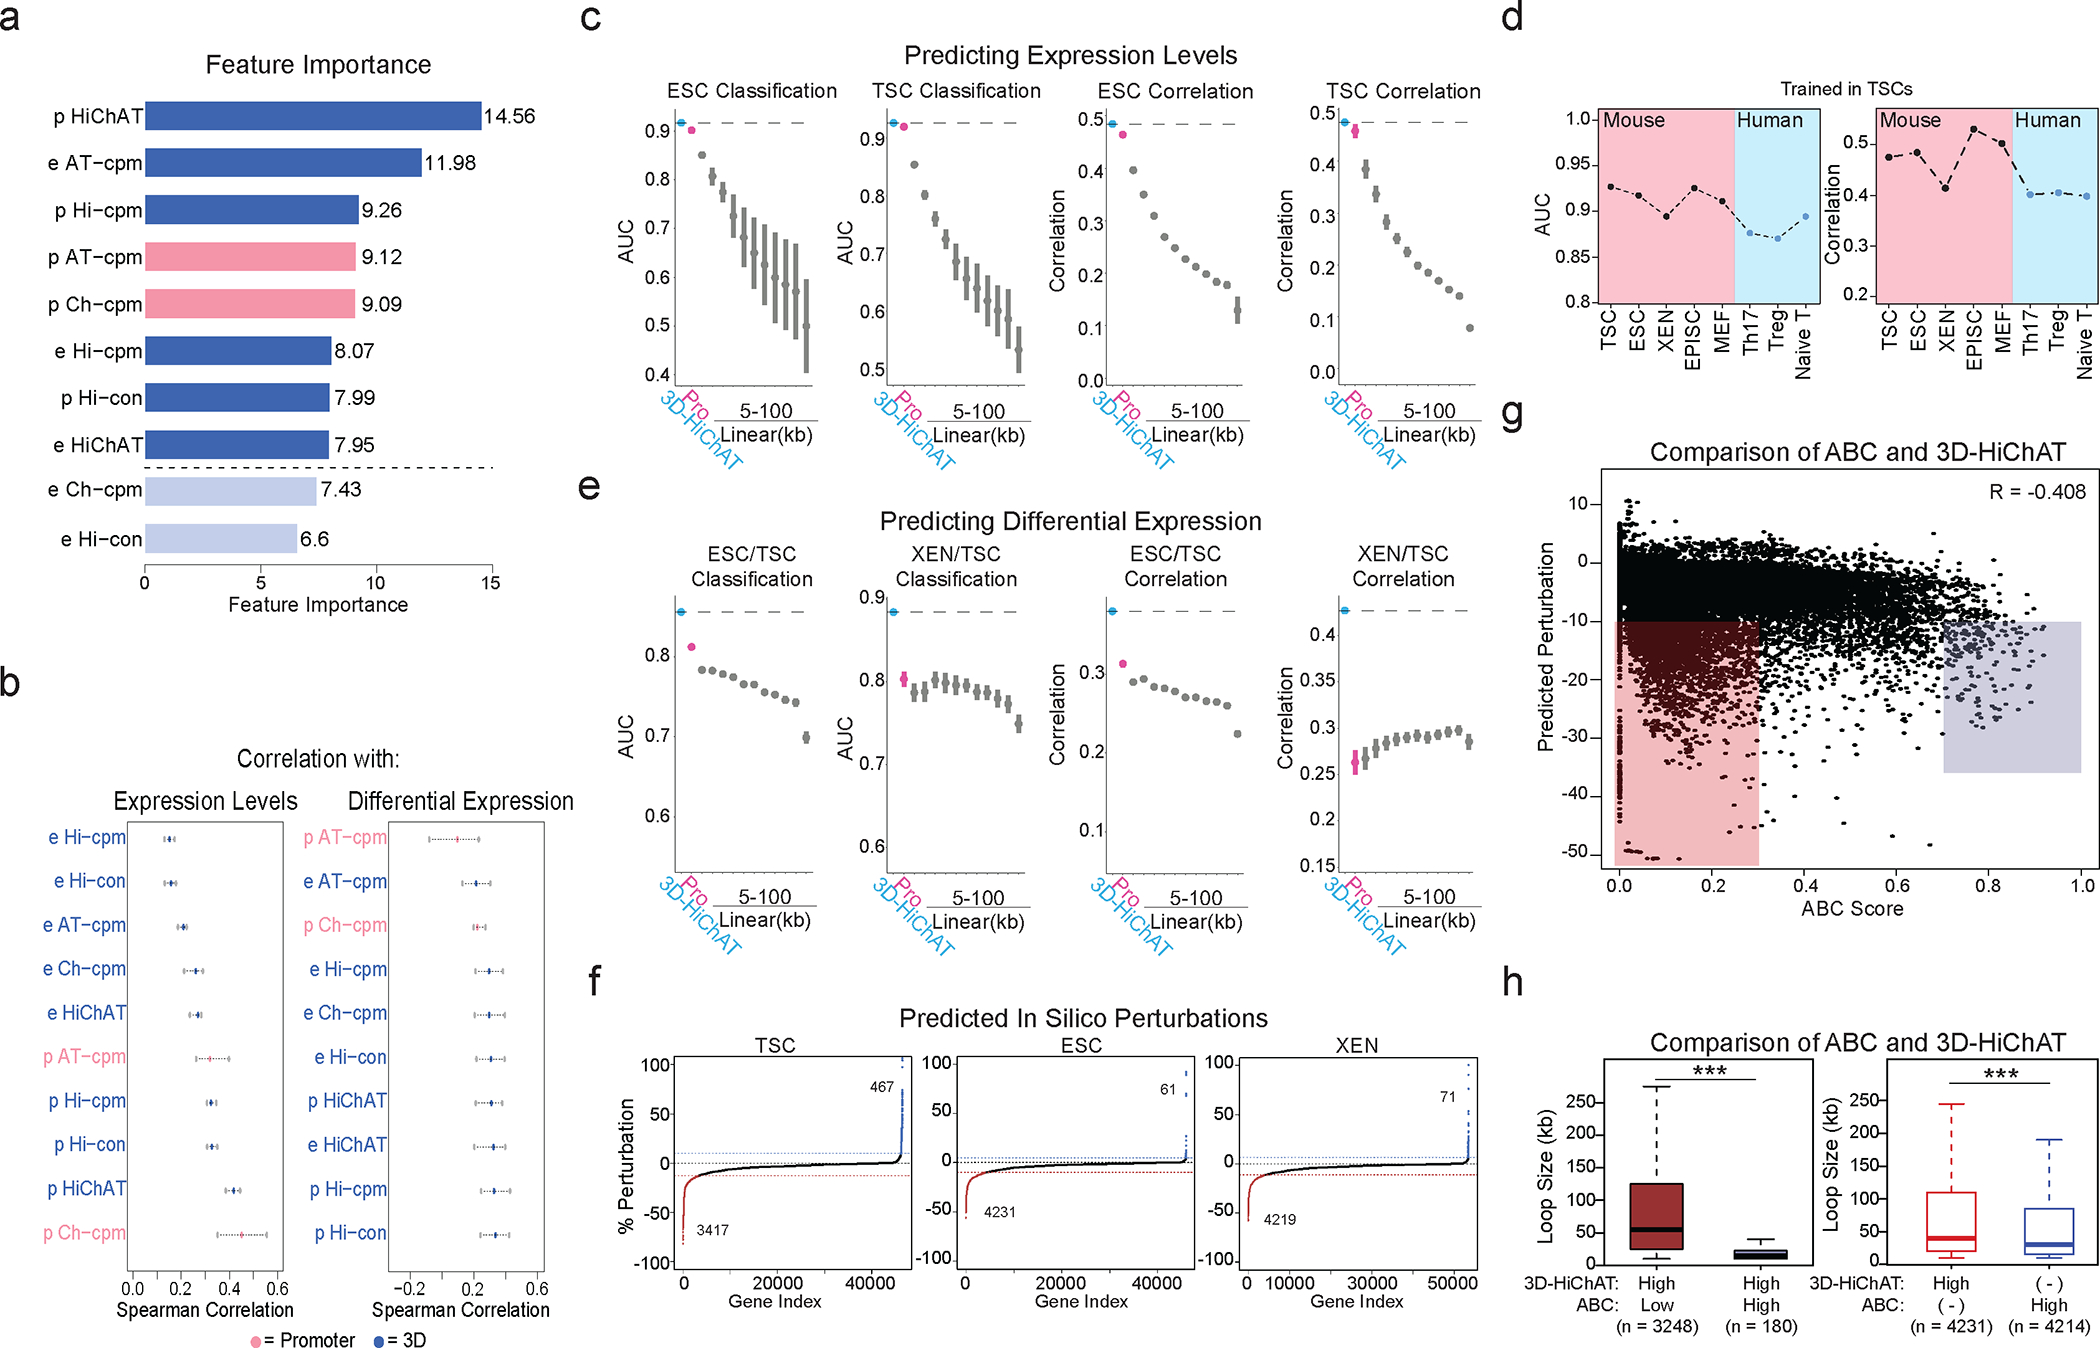
Extended data Fig. 5. Related to Figure 5.

a. Barplot of feature importance showing 10 1D (pink) and 3D (blue) features, ranked from high to low. Light blue indicates features not selected. (See Supplementary Table 6).
b. Spearman correlation values for each variable considered for our 3D model with gene expression (left) and differential expression (right). Dots represent minimum, mean and maximum correlation scores. (See Supplementary Table 6).
c. Area Under Curve (AUC) scores and Spearman Correlation for classifying gene expression (top 10% high vs low, left graph) and predicting levels (right graph) in ESC or TSC cells using 3D-HiChAT, Promoter and Linear models. Dots represent average scores from LOCO training approach (n=20). Error bars show standard deviation. (See Extended Data Figure 5, Supplementary Table 6).
d. Plots showing AUC and Spearman correlation for classifying gene expression (top 10% high vs low, left graph) and predicting levels (right graph) using 3D-HiChAT in various lineages including mouse lineages and published human data: Naïve T cells, T-Helper 17 Cells (Th17), and T regulatory cells (Tregs)130,131.
e. AUC scores and Spearman Correlation generated for classifying differential expression (top 10% up or downregulated, left) and predicting expression changes (right) between XEN and ESCs using 3D-HiChAT, Promoter and Linear models. Dots represent average scores from LOCO training approach (n=20). Error bars show standard deviation. (See Supplementary Table 6).
f. Ranked perturbation scores (%) predicted by in silico perturbations of ~46K E-P pairs in ESC, ~46.7K in TSC and ~53.1K in XEN using 3D-HiChAT. Dotted horizontal lines indicate selected cut-offs for impactful perturbations.
g. Scatterplot comparing predicted perturbation scores from 3D-HiChAT with respective ABC scores. R Spearman correlation values are shown on the top.
h. Boxplots showing that enhancers with high 3D-HiChAT-predicted perturbation scores and low ABC scores (red) are more distal to their target genes (loop size) than those with high scores in both models (blue) (left plot n=3,428 enhancers). Enhancers/anchors with high 3D-HiChAT scores are more distal to the ones with high ABC scores (>0.7) (right plot n=8,445 enhancers). Asterisks indicates significance calculated by two-sided Wilcoxon rank-sum test, p-val<0.001.
Note: all statistics are provided in Supplementary Table 9.
