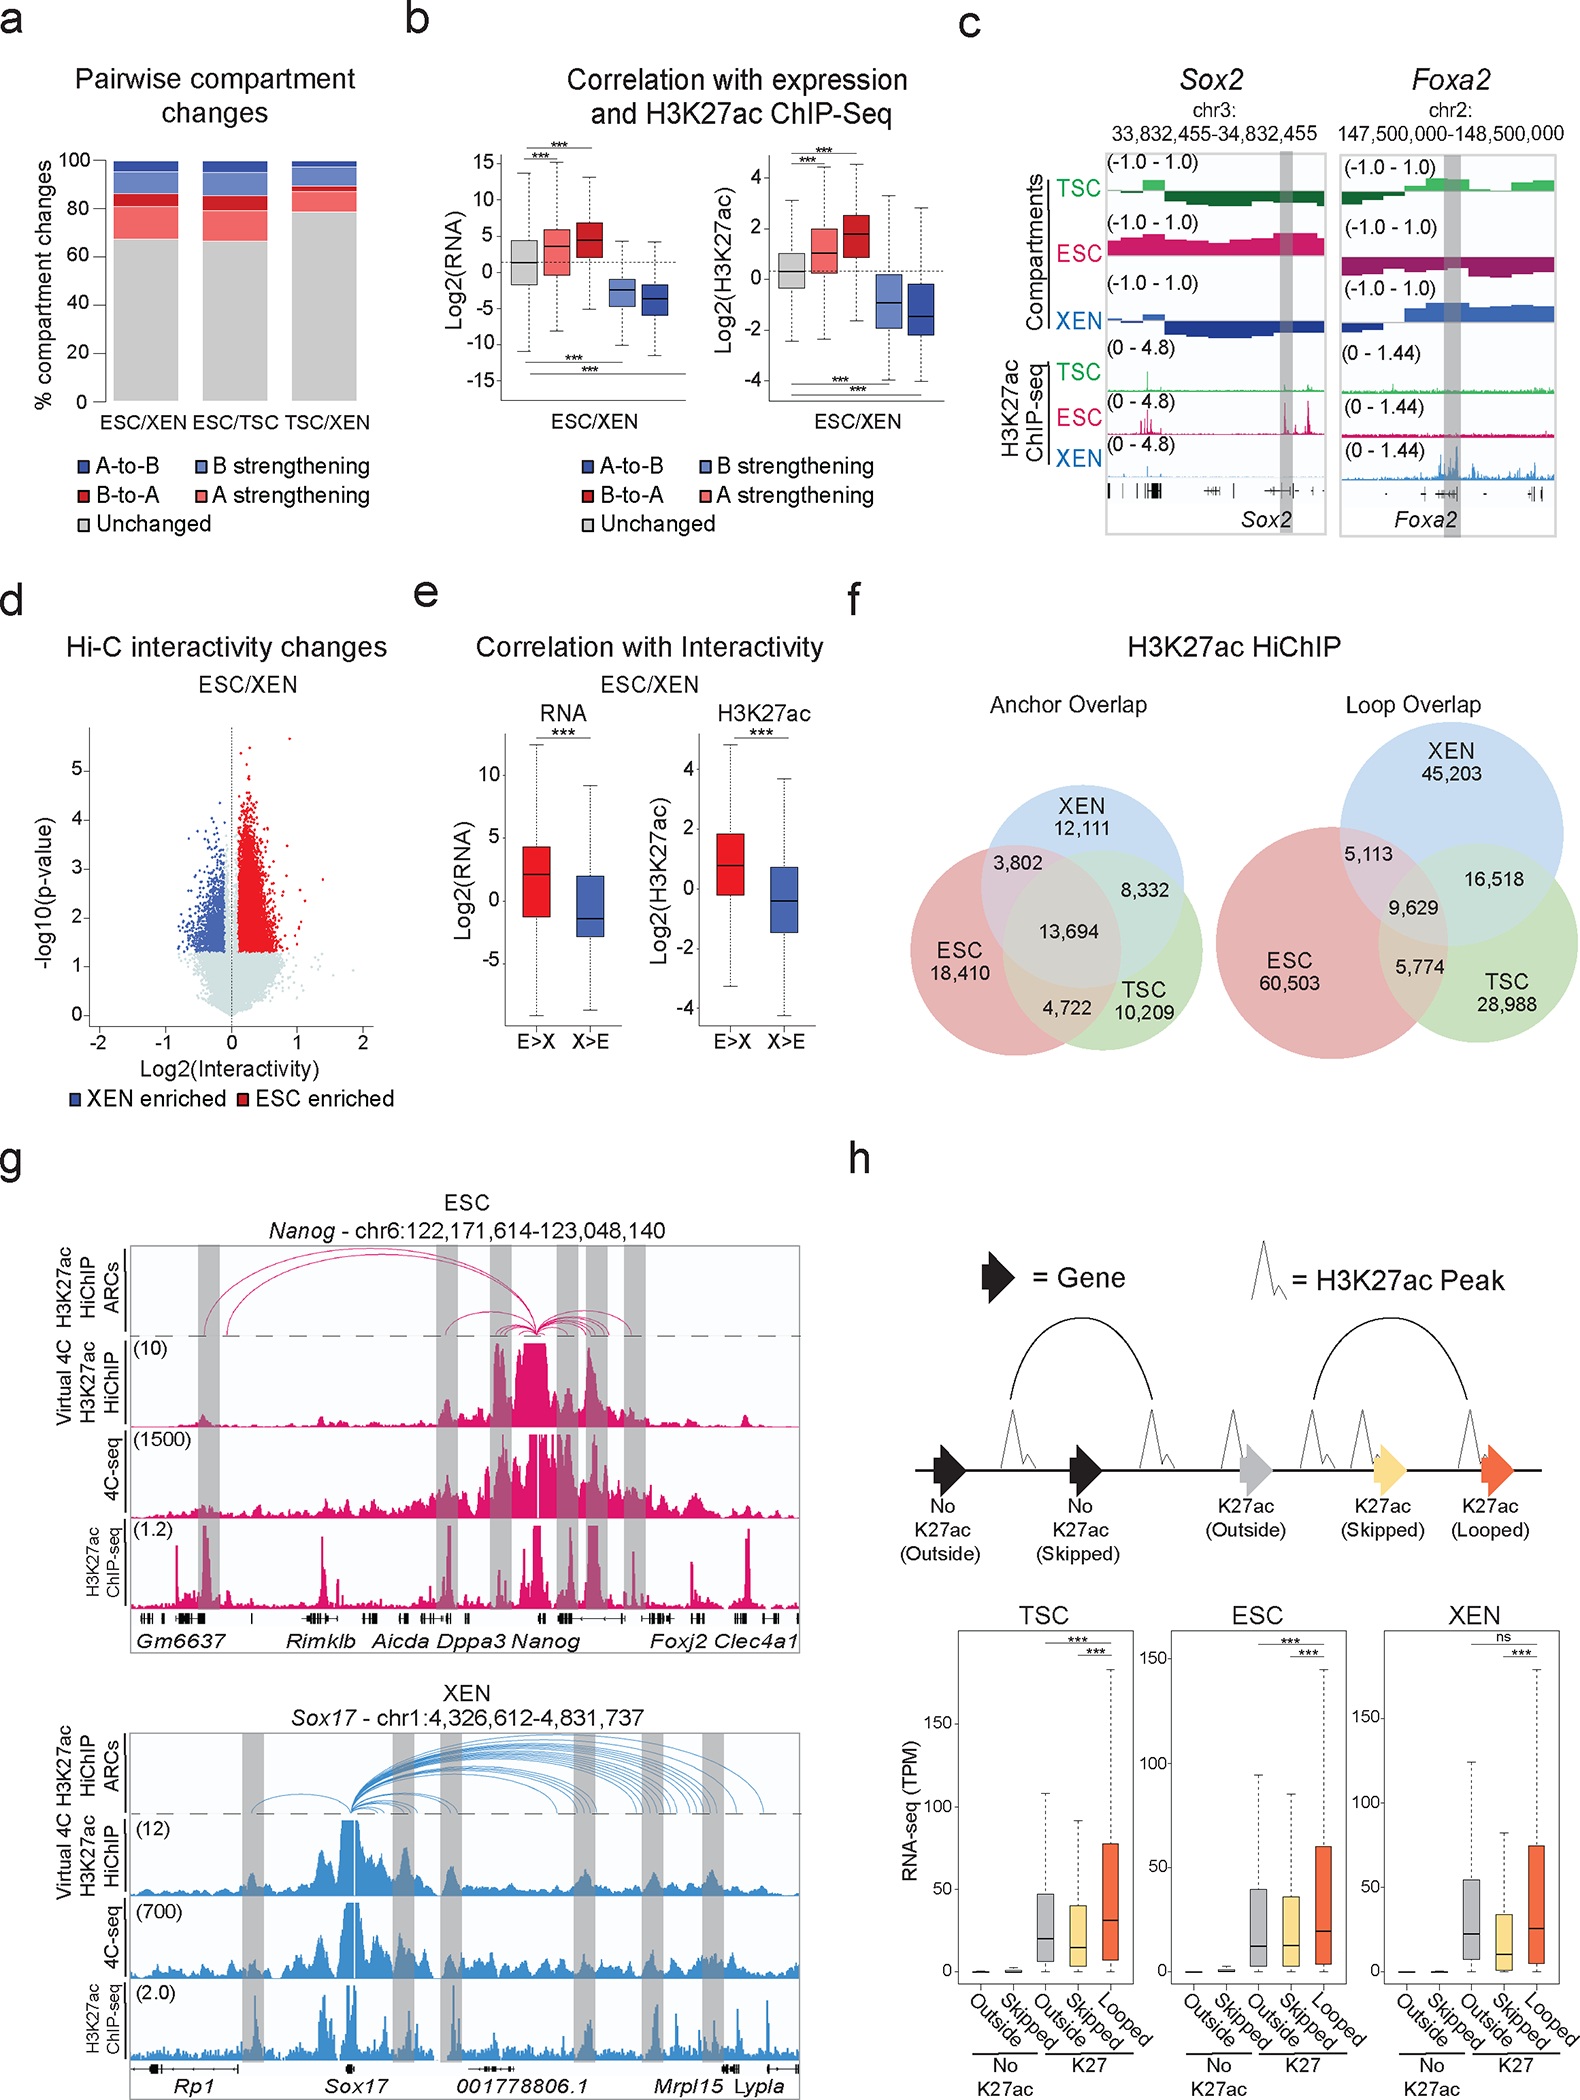
Figure 2. Hi-C and H3K27ac HiChIP reveals multilayered 3D genomic reorganization and complex networks of putative regulatory interactions in TSC, ESC and XEN.

a. Stacked barplots showing A/B Hi-Ccompartment changes for pairwise comparisons. Compartment changes (100kb resolution) assigned based on A/B status and C-score difference between cell lines as: A-to-B shifts (dark blue), B-to-A shifts (dark red), A-strengthening (light red), B-strengthening (light blue) or unchanged (grey). See Methods for details.
b. Boxplots showing median expression changes (left, n=5230 genes) or H3K27ac ChIP-seq changes (right, n=12,225 peaks) between ESC and XEN cells for gene loci assigned to different groups described in (a). Asterisks indicate significance (p<0.001) by two-sided Wilcoxon rank test. (See Extended Data Fig. 2b).
c. Examples of A/B compartment switches around developmentally relevant genes, Sox2 (left-ESC) and Foxa2 (right-XEN).
d. Volcano plot showing differential Hi-C interactivity (40kb resolution) between ESC and XEN (n=2 independent replicates per sample). X-axis shows delta interactivity, y-axis shows −log10(p-value) calculated by two-sided Student’s t-test. Significant changes (p-value<0.05 and Diff>0.1 or <−0.1) are highlighted in blue (higher in XEN) or red (higher in ESC). (See Extended Data. Fig. 2c).
e. Boxplots showing changes in gene expression (left, n=645 genes) and H3K27ac ChIP-seq (right, n=11,174 peaks) between ESC and XEN at regions with delta interactivity, described in (d). (See Extended Data. Fig. 2d). Asterisks indicate significance (p<0.001) by two-sided Wilcoxon rank test.
f. Venn diagrams of shared and unique annotated anchors (left) and loops (right) in TSC (green), ESC (red) and XEN (blue) cells detected by H3K27ac HiChIP. Interactions identified by FitHiChIP 2.0 (5kb resolution).
g. IGV tracks showing concordance between H3K27ac HiChIP (Arcs on top, virtual 4C of normalized H3K27ac HiChIP signal in the middle) with independent in situ 4C-seq experiments around selected viewpoints (top = Nanog promoter, bottom = Sox17 promoter) and H3K27ac ChIP-seq tracks. Common interactions are highlighted in grey.
h. Schematic (top) defining gene categories by HiChIP loop status (looped, skipped, outside) and H3K27ac promoter presence (noK27ac vs K27ac). Boxplot (bottom) depicting median gene expression. n=26,742 genes across 2 independent RNA-seq samples per cell line. Asterisks indicate significant differences (p-val<0.001) by two-sided Wilcoxon rank test.
Note: all statistics are provided in Supplementary Table 9.
