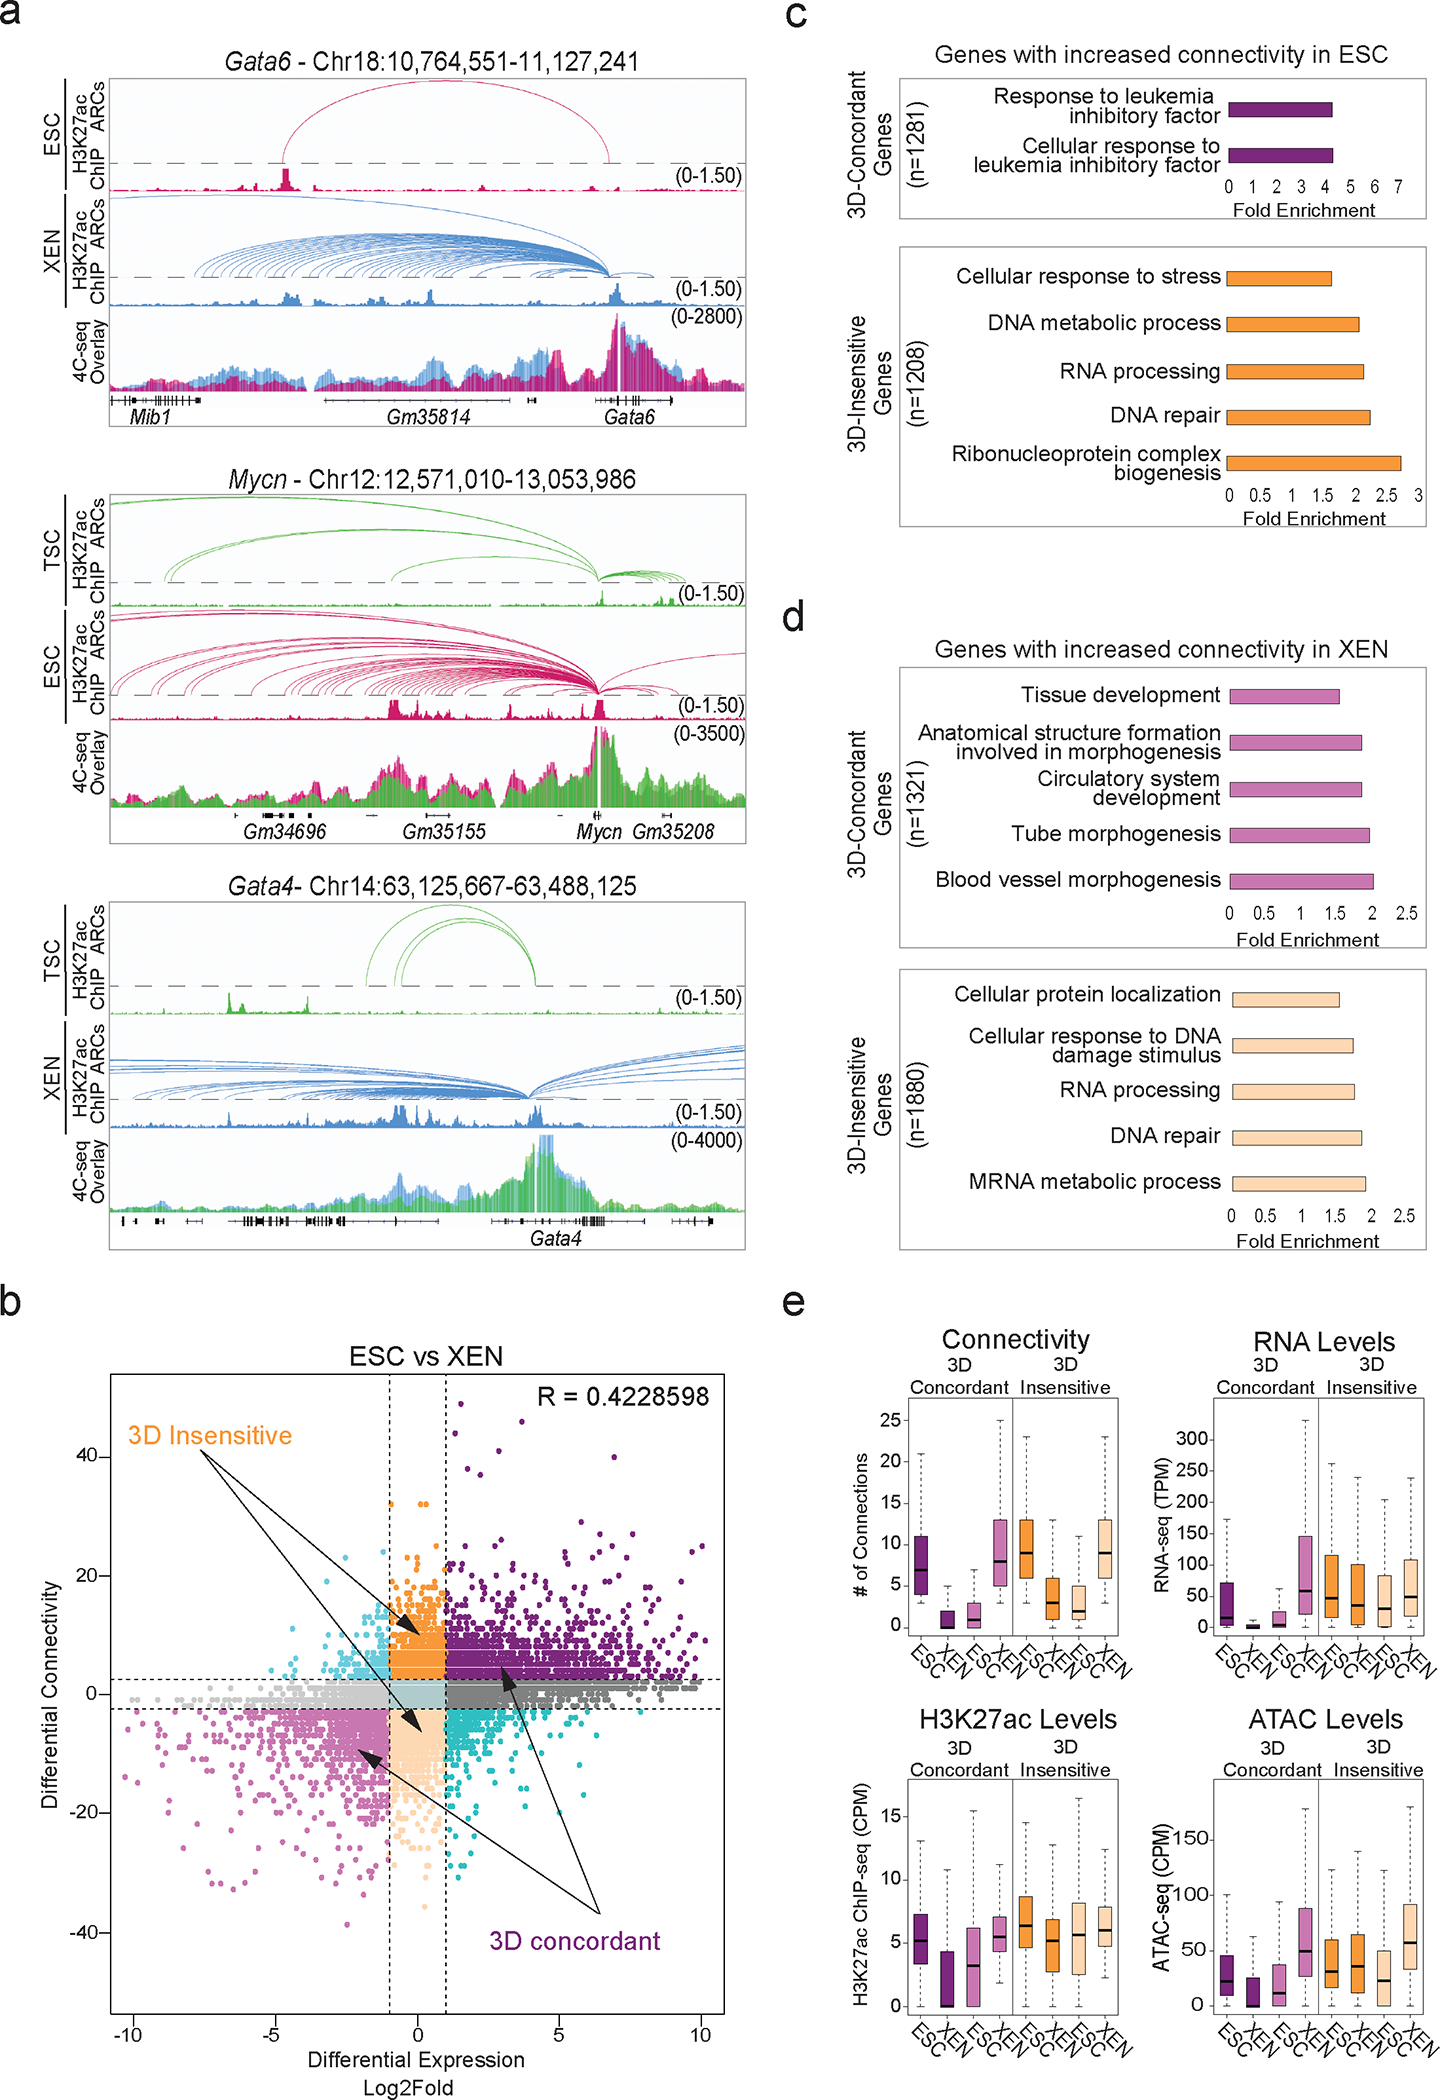
Figure 4. Association of 3D rewiring with cell-type specific gene expression.

a. Examples of 3D rewiring at developmental genes in TSC, ESC and XEN detected by H3K27ac HiChIP (arcs on top with respective H3K27ac ChIP-seq tracks), validated by 4C-seq (merged tracks at the bottom). Averaged 4C-seq signals from n=3 independent replicates.
b. Correlation between differential HiChIP connectivity/hubness and differential gene expression in ESC vs XEN cells. R represents Spearman correlation. Two prominent groups are highlighted: 3D-insensitive genes with differential connectivity >3 but no transcriptional changes (log2FC<1 or >−1) and 3D-concordant genes with connectivity and expression changes (log2FC >1 or <−1) positively correlating (Supplementary Table 5).
c. Gene ontology depicting select biological processes significantly enriched in 3D concordant (purple) and 3D insensitive (orange) groups in ESC cells as defined in (b). (See Supplementary Table 3).
d. Same as (c), but for XEN cells. (See Supplementary Table 3).
e. Comparison of connectivity, gene expression (TPM), H3K27ac and ATAC CPM levels at promoters of 3D-concordant (n=2,235) and 3D-insensitive genes (n = 2581) in ESC and XEN cells. Two-sided Wilcoxon rank sum test was used for all comparisons (Supplementary Table 9).
Note: all statistics are provided in Supplementary Table 9.
