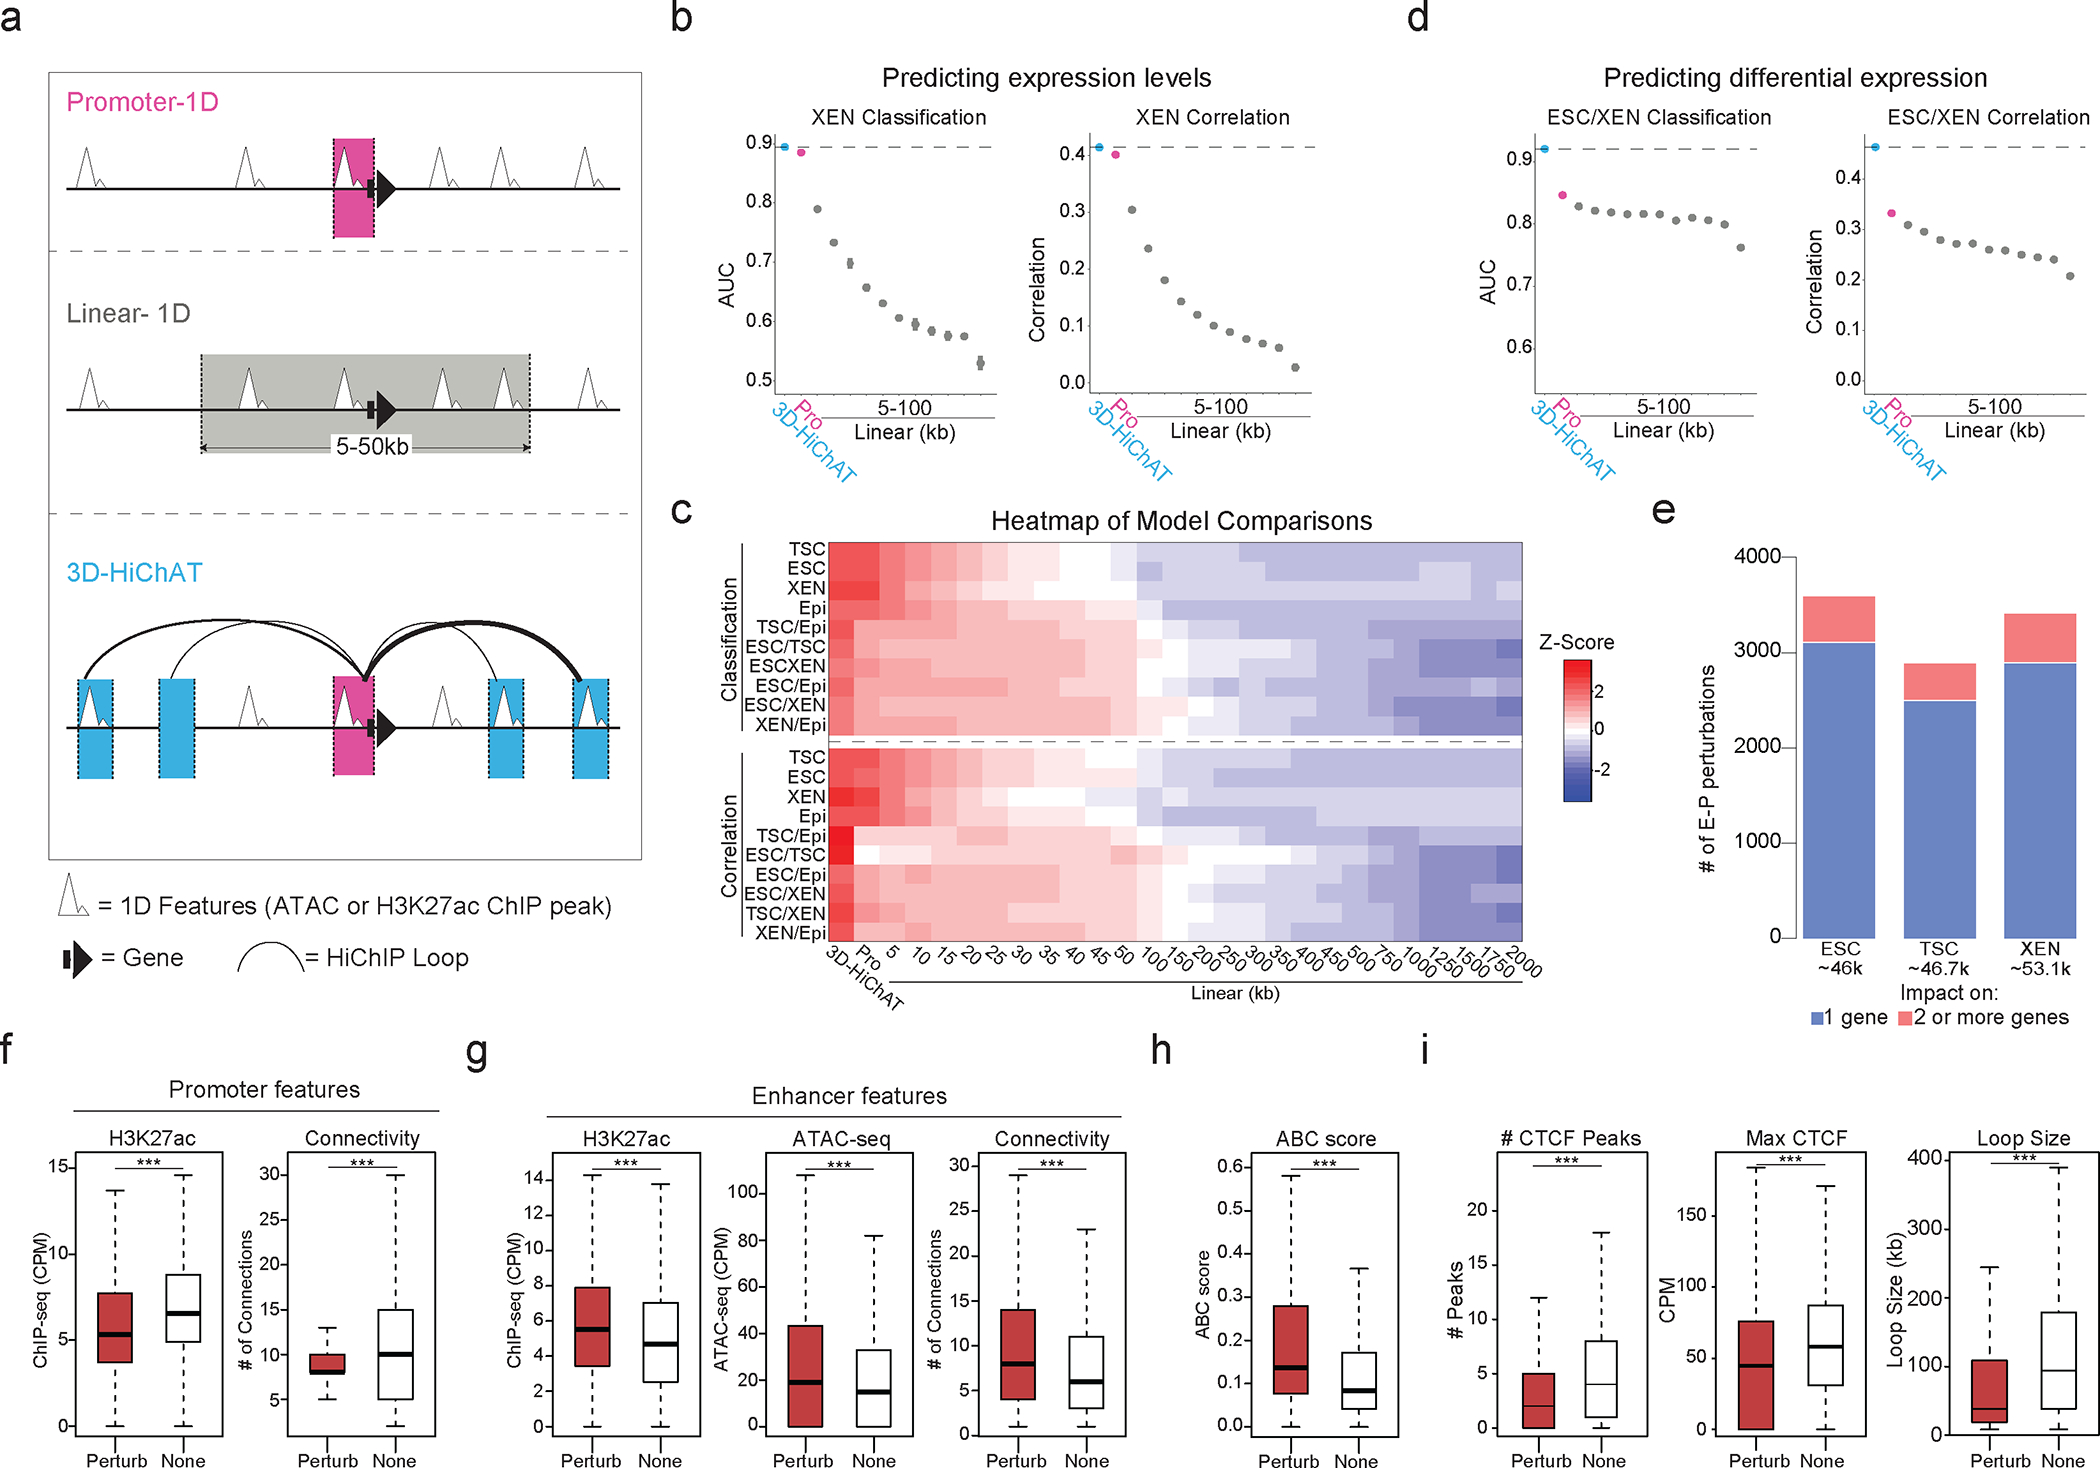
Figure 5. Predictive modeling using 3D chromatin features outperforms promoter- or 1D-based models for gene expression levels or cell-type specificity.

a. Schematic illustration of 1D or 3D variables used for modeling gene expression. (See Supplementary Table 6).
b. Area Under Curve (AUC) scores and Spearman Correlation for classifying gene expression (top 10% high vs low, left graph) and predicting absolute levels (right graph) in XEN using 3D-HiChAT, Promoter and Linear models. Dots represents average scores from the LOCO training approach, error bars show standard deviation. (See Extended Data Figure 5 and Supplementary Table 6).
c. Top: Heatmap of z-scored normalized AUC values across tested models for classification of gene expression or differential gene expression (top 10% high or low) in each cell line. Bottom: Heatmap of z-scored normalized Spearman correlation values across all models for prediction of gene expression levels or differential expression in each lineage. (See Supplementary Table 6).
d. AUC scores and Spearman Correlation generated for classifying differential expression (top 10% up or downregulated, left) and predicting expression (right) between XEN and ESCs using 3D-HiChAT, Promoter and Linear models. Dots represents average scores from the LOCO training approach, error bars show standard deviation. (See Extended Data Figure 5 and Supplementary Table 6).
e. Barplots showing numbers of E-P perturbations predicted to reduce one (blue) or more (pink) target gene expression using 3D-HiChAT. (See Extended Data Fig. 5f).
f. Boxplots showing median H3K27ac signals (left) or Connectivity (right) at promoter anchors of either perturbed (Perturb, n=4231) or unaffected E-P pairs (None, n= 4231) in ESC as described in (e). Asterisks indicate significance pval<0.001 by Two-sided Wilcoxon rank test.
(g-h). Boxplots showing median H3K27ac signal, ATAC-seq signal, Connectivity (g) and ABC score (h) at enhancer anchors of either perturbed (Perturb n=4231) or unaffected E-P pairs (None n=4231) in ESC as described in (e). Asterisks indicate significance pval<0.001 by two-sided Wilcoxon rank test.
i. Boxplots showing median numbers and max intensities of intervening CTCF peaks and genomic distance between perturbed (Perturb n=4231) or unaffected E-P pairs (None n=4231) in ESC as described in (e). Asterisks indicate significance pval<0.001 by two-sided Wilcoxon rank test.
Note: all statistics are provided in Supplementary Table 9.
