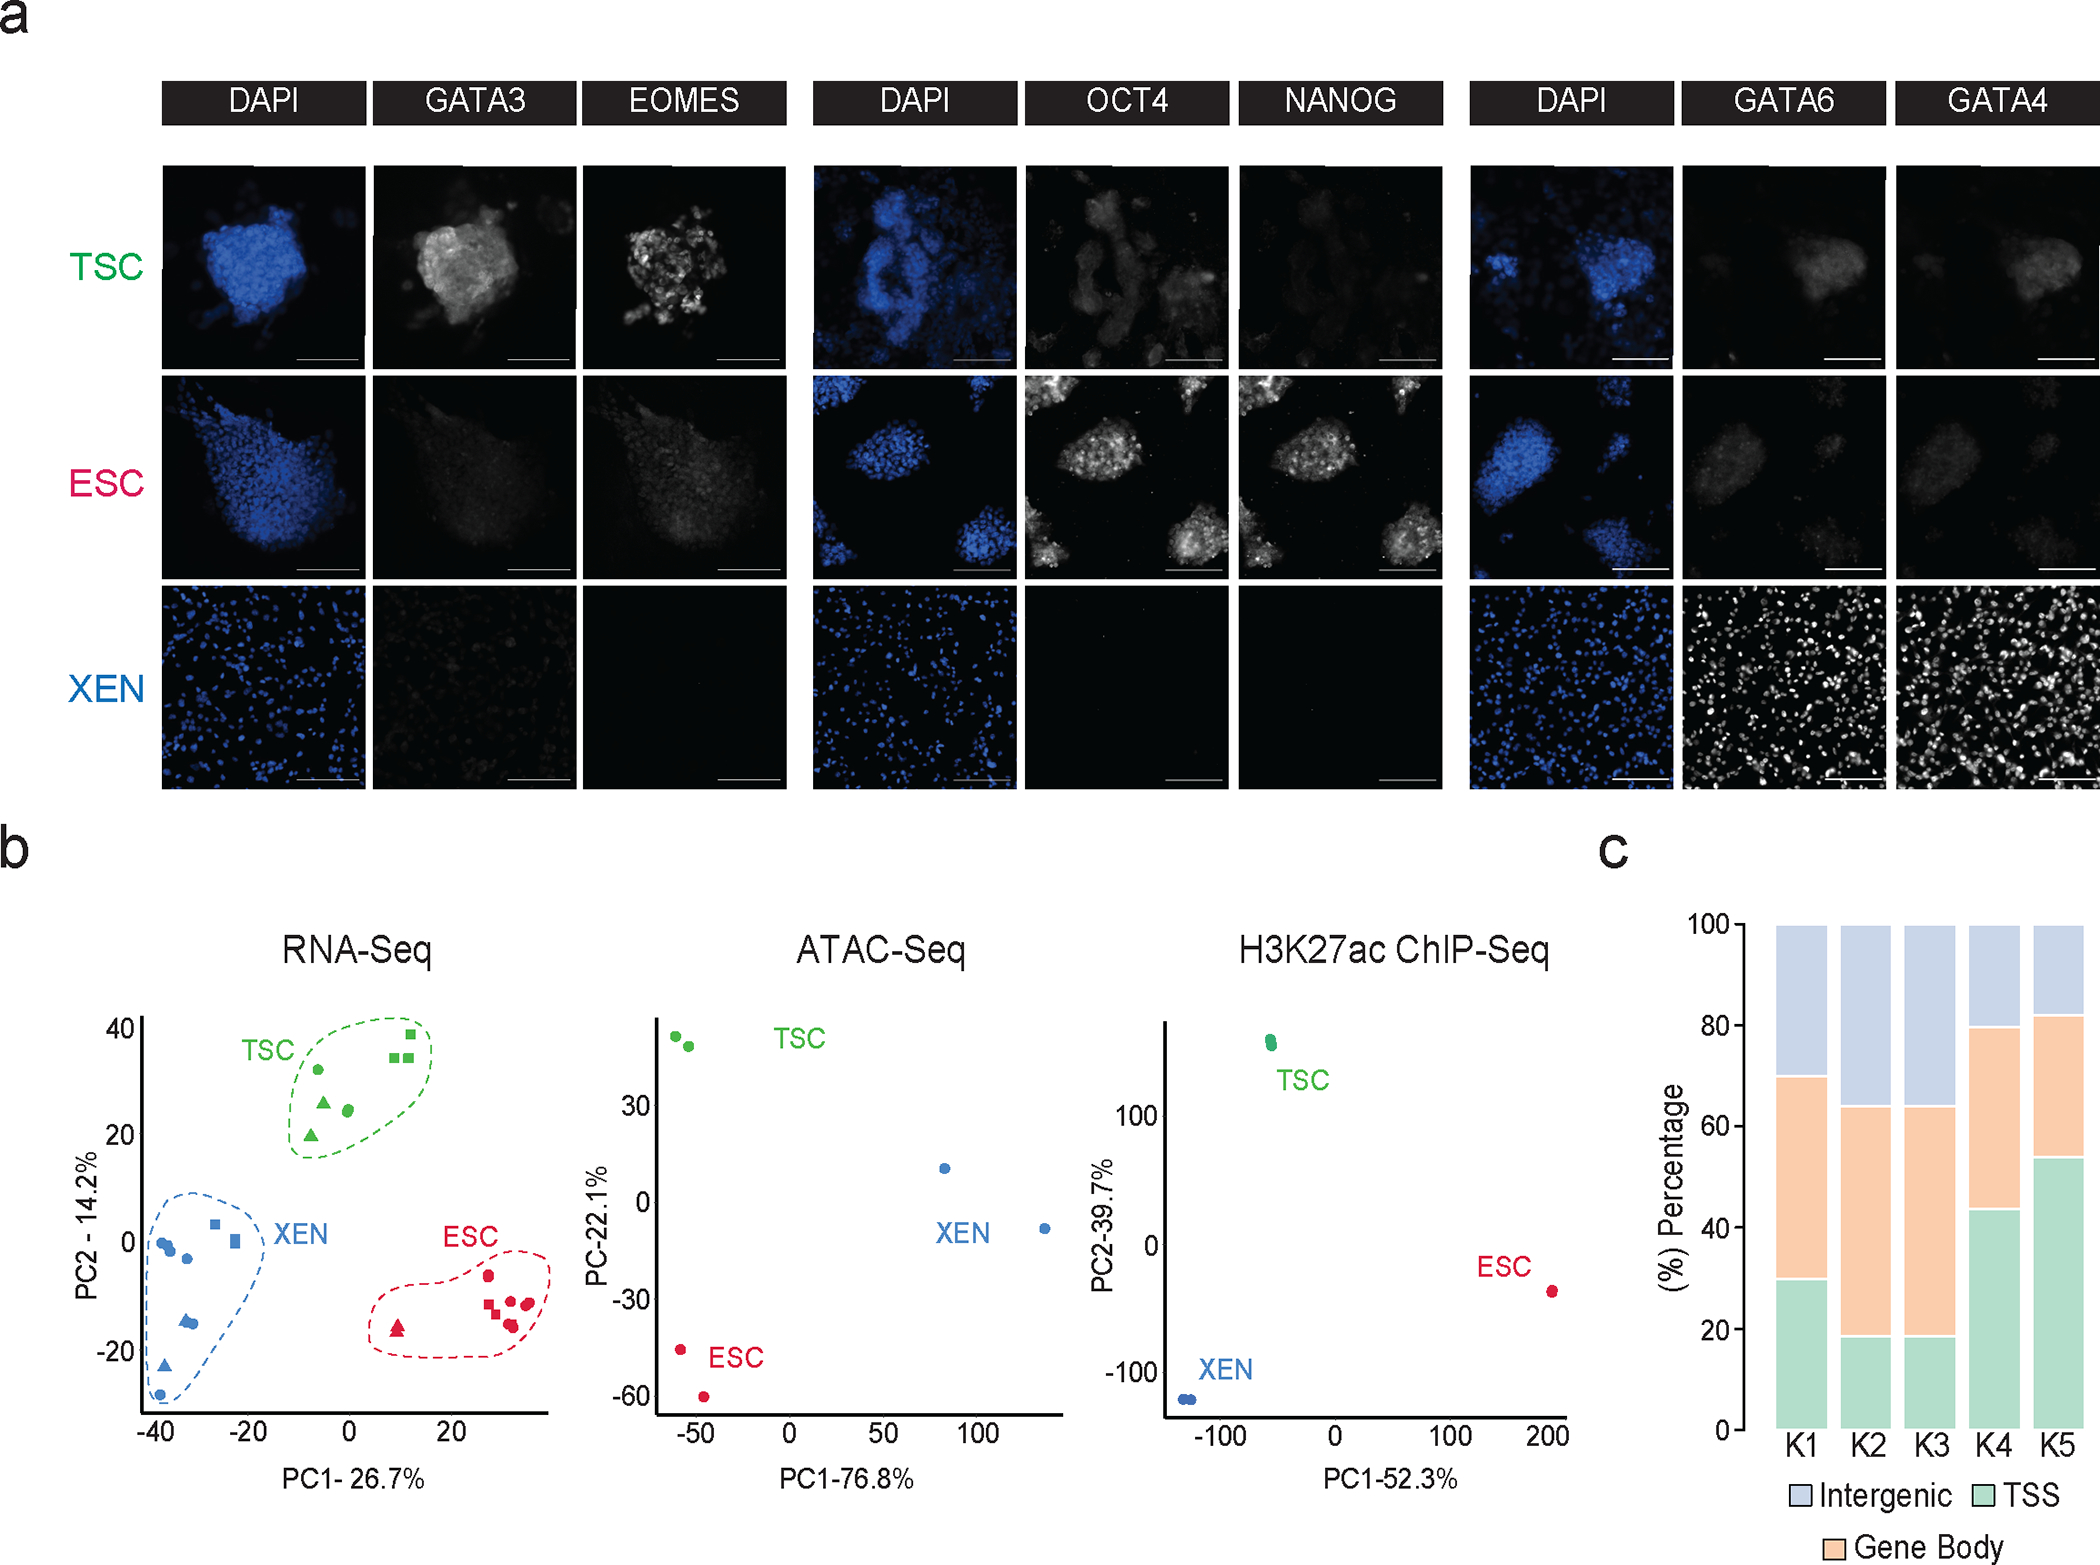
Extended Data Fig. 1. Related to Figure 1.

a. Representative single (xy) stack epifluorescence images of immunofluorescence experiments showing expression of key lineage markers (greyscale) in TSC, ESC and XEN cells. Cells were counterstained with DAPI (blue) for DNA content. n=3 independent experiments. Scale bar 100μm.
b. Principal component analysis (PCA) of all TSC, ESC and XEN replicates based on their RNA-seq, ATAC-seq and H3K27ac ChIP-seq profiles. PCA plots were designed based on the top10% of most variable genes or peaks in all three cell lines. In each plot, circles indicate the experimental data presented in this study, while squares and triangles correspond to publicly available RNA-seq data (Supplementary Table 8) or independent -unpublished- studies from our lab, respectively.
c. Stacked barplot showing the distribution of H3K27 occupancy among intergenic regions, gene bodies or TSS (promoter +/− 1.5kb) for each K-Mean cluster as identified in Fig.1c.
Note: all statistics are provided in Supplementary Table 9.
