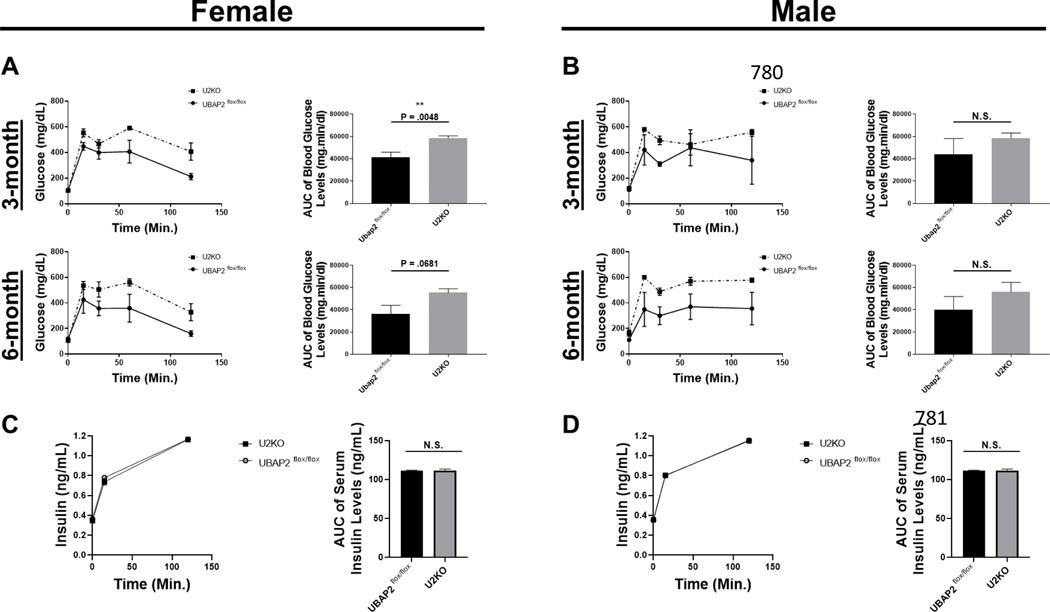
Figure 3. IP-GTT (A-B) and Serum Insulin ELISA levels (C-D) in Ubap2flox/flox and U2KO, stratified by age and sex, with a chow-fed diet.
(A-B) Glucose levels during IP-GTT experiments. After a 12 hour fast, animals received a dose 1g/kg aqueous glucose delivered into the stomach through a gavage probe. The blood glucose levels (mg/dL) were measured at different time points using a glucometer. Glucose area under the curve (AUC) were generated through a baseline (Y=0) and ignoring peaks less than 10% of the distance from min-max of Y. The AUC of Blood glucose levels was analyzed via an ordinary One-Way ANOVA with Multiple Comparisons to the Control (Ubap2flox/flox) of each stratification category. Data are expressed as mean ± standard error of the mean (SEM), n=5–7. (C-D) Serum Insulin levels through ELISA in 6-month animals stratified by sex. Comparisons were made with the Student’sT-test. Data are expressed as mean ± standard error of the mean (SEM), n=5–7. All analyses were performed through GraphPad-PRISM (7.04) (N.S. = Not significant).

