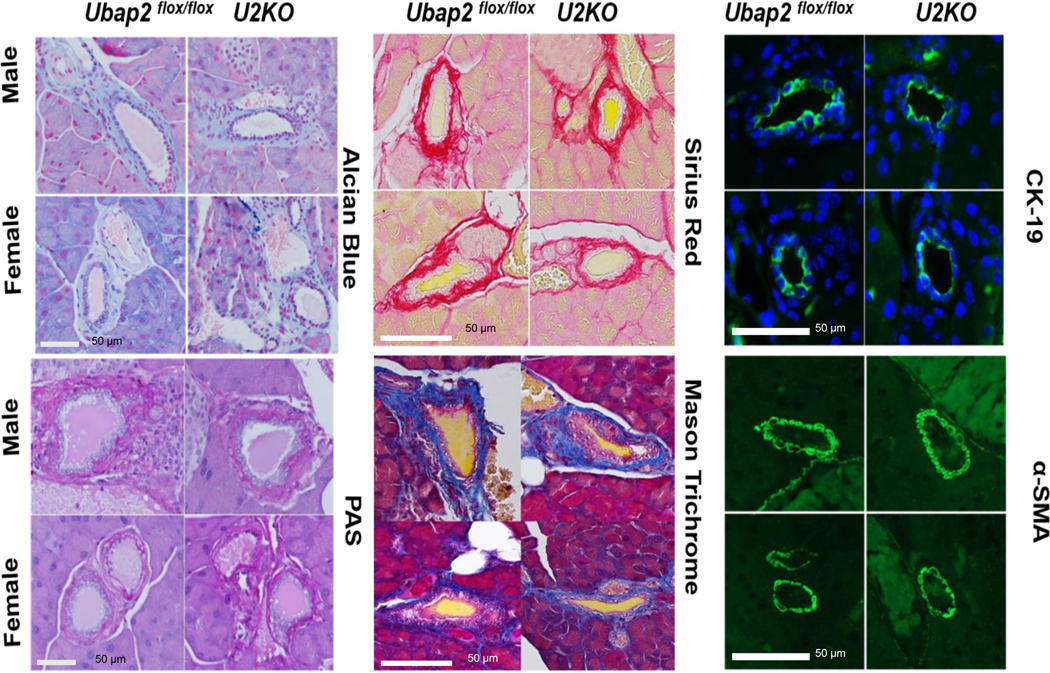
Figure 5. Representative images of pancreatic tissue sections staining for Extracellular matrix and mucin in Ubap2flox/flox and U2KO animals.

Mucin content were assessed by Alcian Blue stains (Top row, left column) and PAS stains (bottom row, left column). Collagen content in the pancreas was assessed by Sirius red (Top row, middle column) and Mason’s trichrome stain (Bottom row, middle column). The expression of α-smooth muscle actin (α-SMA) were depicted in (Bottom row, Right column) and expression of CK-19 were shown in the (Top row, Right column).
