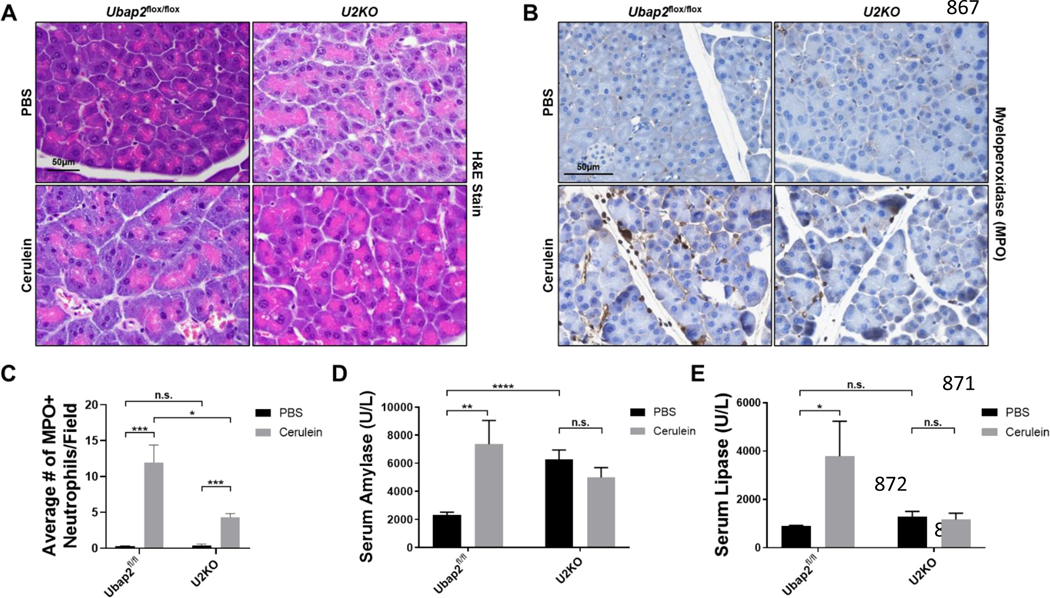
Figure 6. The Cerulein-induced pancreatitis response in Ubap2flox/flox and U2KO mice.
(A) H&E Staining of pancreatic tissue sections in Ubap2flox/flox and U2KO animals that were either injected with Cerulein (50ug/kg) or an equivalent volume of PBS as a control. (B) Histological Stains ofMyeloperoxidase in tissues of control animals and U2KO animals under either PBS or cerulean treatment and its quantification (C). (D-E) Serum Amylase (D) and lipase (E) levels of control (Ubap2flox/flox) and U2KO animals measured in U/L. Baseline reference ranges: AMYL = 1691–3615U/L,LIPA = 600–1000U/L. Comparisons were made with the Student’s T-test. Data are expressed as mean ± standard error of the mean (SEM), n=5–7. All analyses were performed through GraphPad-PRISM (7.04) (N.S. = Not significant).

