
Figure 2.
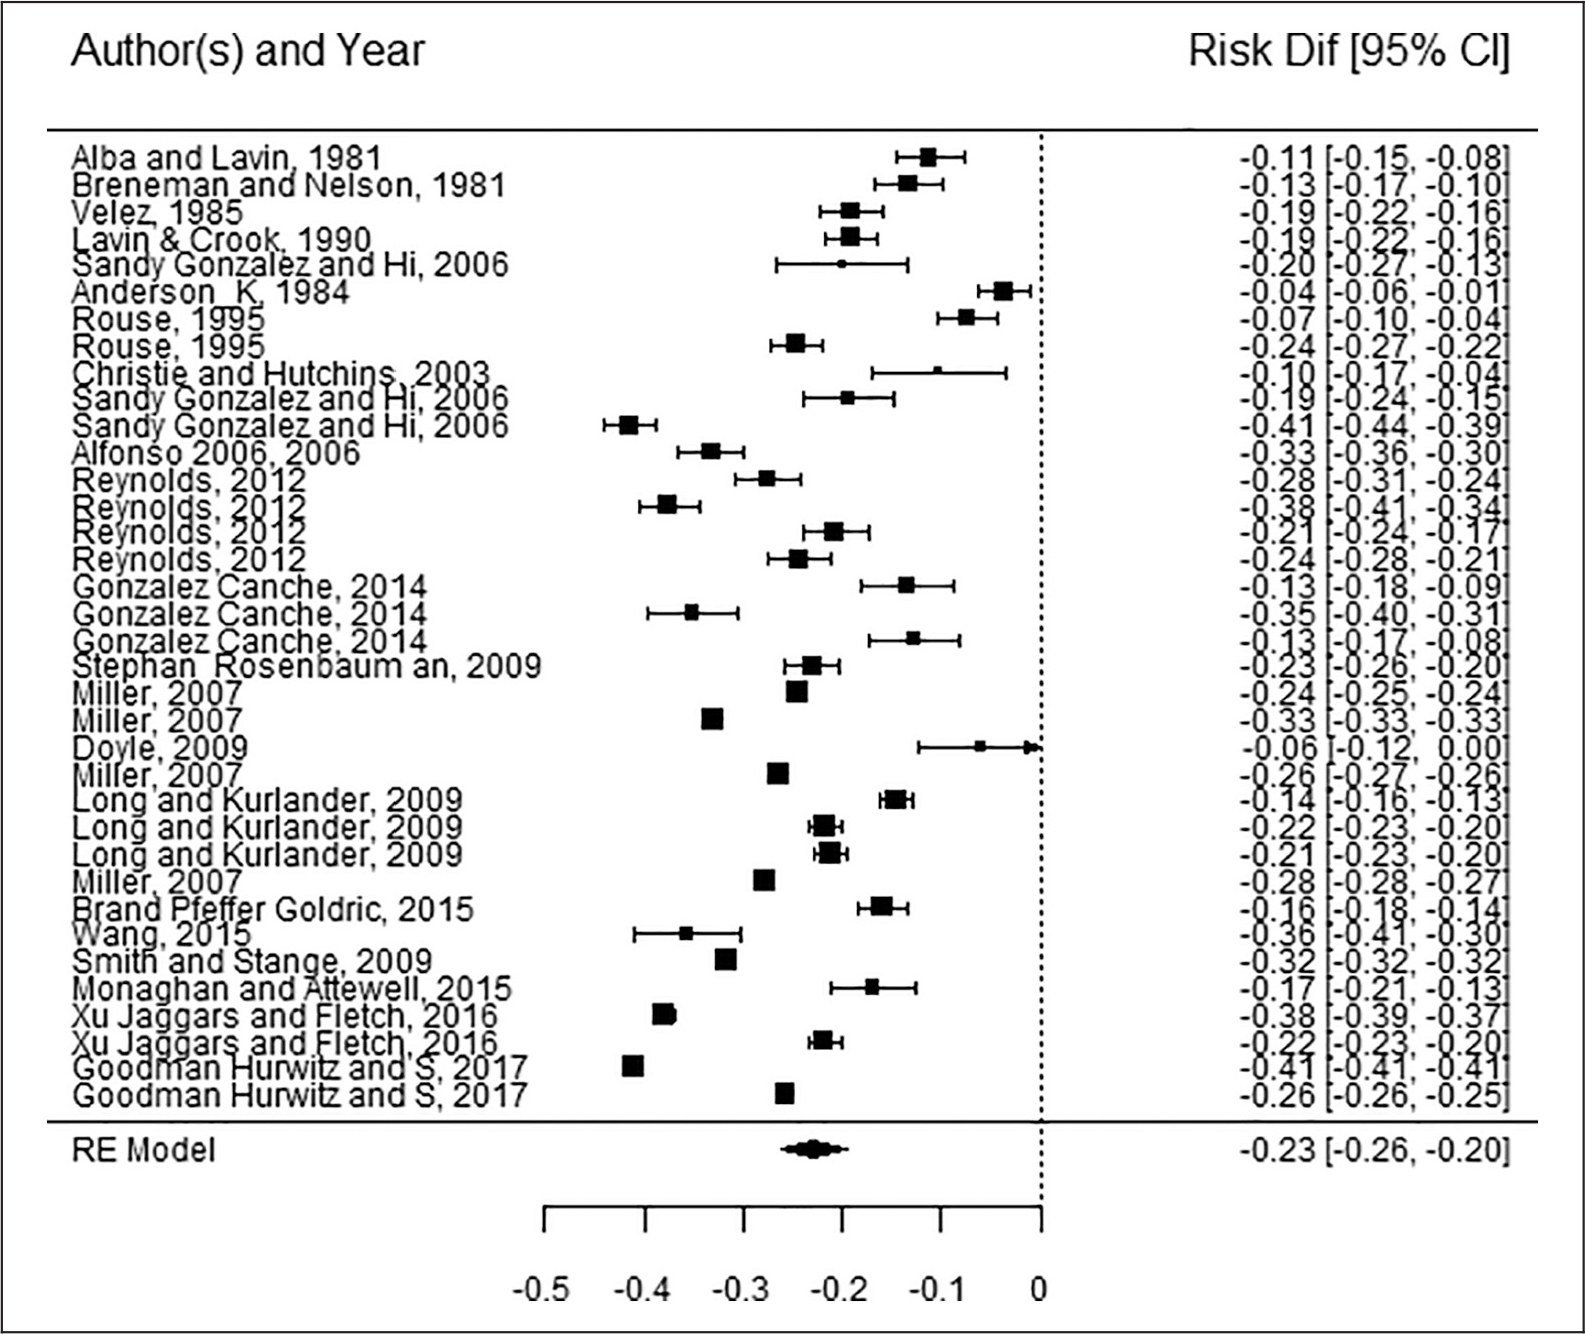
Forest plot: Best-evidence sample.
Note: The figure presents the unadjusted risk difference with 95 percent confidence intervals from each effect size in the best-evidence sample, ordered by year of college entry.
Official websites use .gov
A
.gov website belongs to an official
government organization in the United States.
Secure .gov websites use HTTPS
A lock (
) or https:// means you've safely
connected to the .gov website. Share sensitive
information only on official, secure websites.
Forest plot: Best-evidence sample.
Note: The figure presents the unadjusted risk difference with 95 percent confidence intervals from each effect size in the best-evidence sample, ordered by year of college entry.