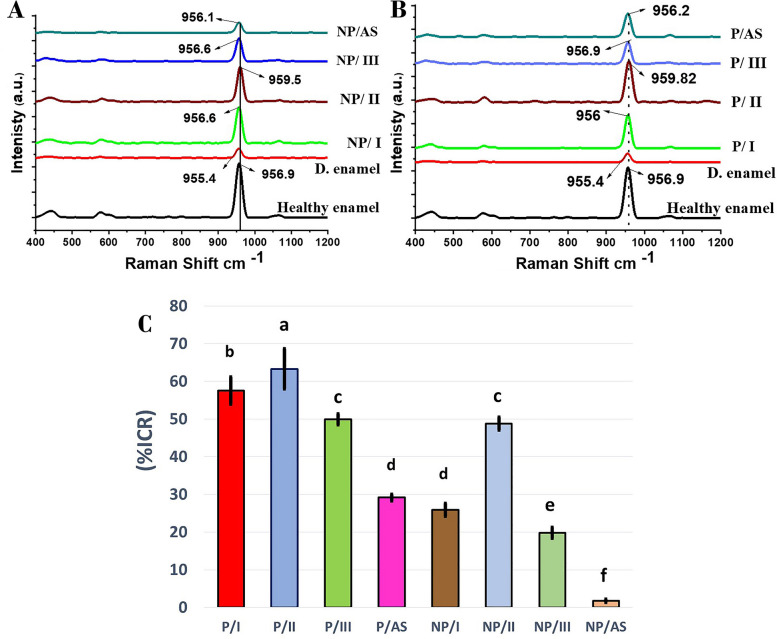
Fig. 6.
A representative Raman spectra of non-peptide treated groups in comparison to control healthy and demineralized enamel showing the exact position of (PO43-) peak, solid line; indicates a ~3 cm-1 shift to higher value in NP/II. B representative Raman spectra of peptide-treated groups compared to control healthy and demineralized enamel showing the exact position of (PO43-) peak, dotted line indicates a ~3 cm-1 shift to higher value in P/II. C Mean Raman intensity change ratio (%ICR) of the different remineralizing groups. Different letters demonstrate statistically significant difference (P< 0.05)

