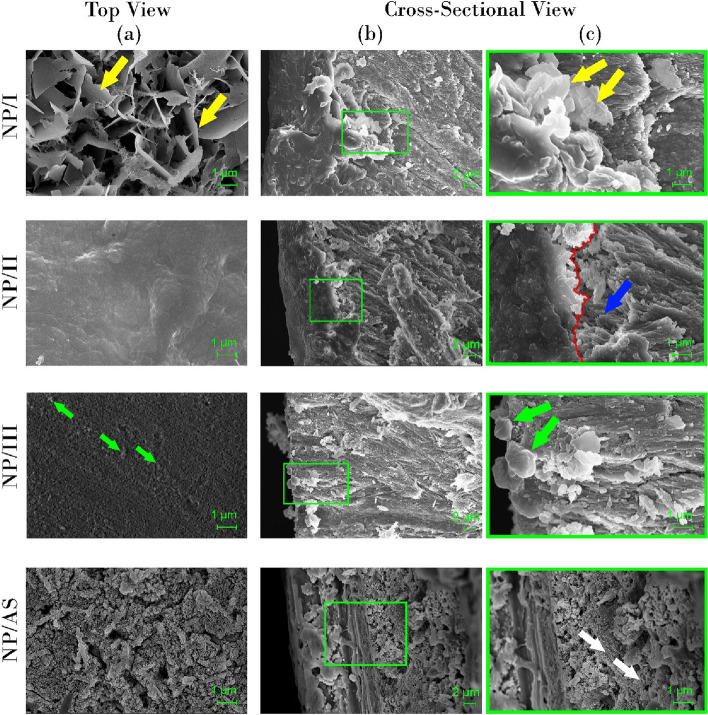
Fig. 9.
SEM micrographs of non- peptide treated groups (top- view (a) and cross-sectional view (b) at 3000X and (c) Magnified image of the square in panel of (b) at 10000 X . Yellow arrows; thin plates detected covering the demineralized enamel surface in top view with its remnants in cross-sectional view of NP/I. NP/II; red line; interface between dense mineral layer and the underlying enamel, blue arrow; area of separation between the mineral layer and native enamel. Green arrows; discrete deposits in NP/III. White arrows; eroded deformed enamel rods in NP/AS

