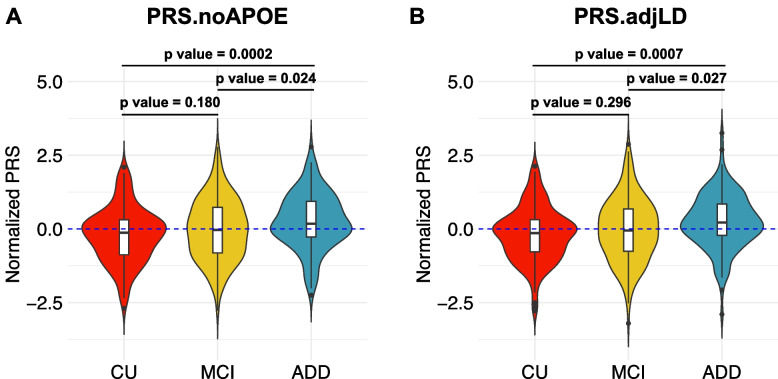
Fig. 1.
The PRS.noAPOE in the ADD group was significantly higher than those in the CU and MCI groups. The PRS.noAPOEs (A) or PRS.adjLD (B) in each group were represented by violin plots (CU, n = 145; MCI, n = 220; ADD, n = 139). Each violin plot includes the kernel probability density of the data at different values and the box plots with the median value and the interquartile range. Tukey’s HSD test was used to perform multiple comparisons of PRSs among each group. We normalized the PRS distribution to have a mean of 0 and an SD of 1. CN = cognitively normal; MCI = mild cognitive impairment; ADD = Alzheimer’s disease dementia

